Tips for Debugging your Angular Applications

We’ll look at some unique methods and tools that can be useful for debugging Angular applications.
Debugging is an important skill for developers. It is as important as programming itself. Programming is a learned skill—same goes for debugging.
If debugging is the process of removing software bugs, then programming must be the process of putting them in. - E. W. Dijkstra
It is difficult to develop a program that is completely bug-free. This is why it is important to harness tools and techniques to flesh out the bugs embedded within your codebase.
The Angular framework utilizes some of the popular debugging techniques, and also has some unique tools and techniques unique to debugging its applications. We’ll look at some methods and tools that can be useful for debugging Angular applications.
Augury
Augury is a Chrome and Firefox DevTools extension that can be used to visualize, debug and profile Angular applications. Using Augury, you can view the component tree of Angular applications, you can view the current state of components, and you can view how components react to state changes.
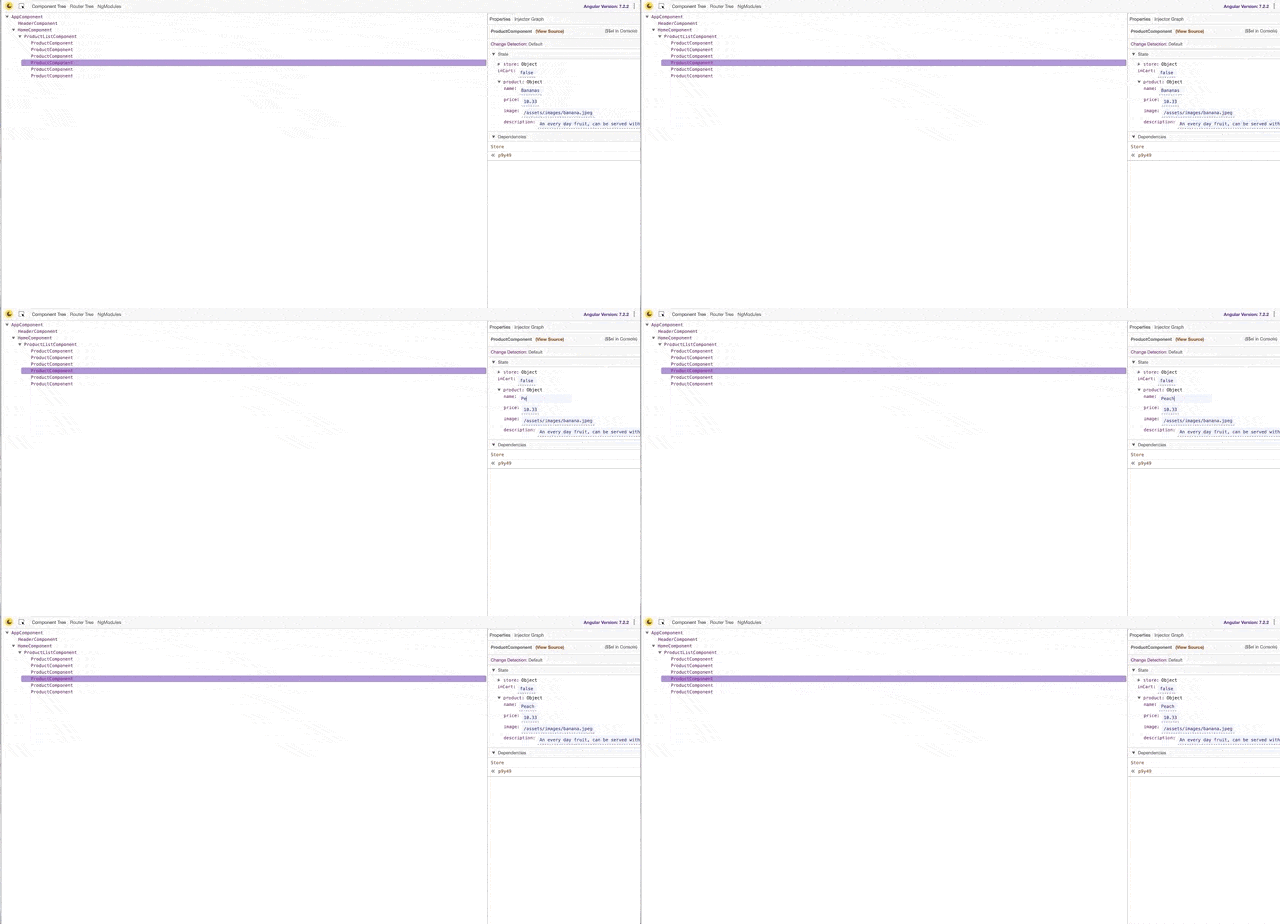
Augury can also be used to view the source of each component by clicking on the view source link beside each component.
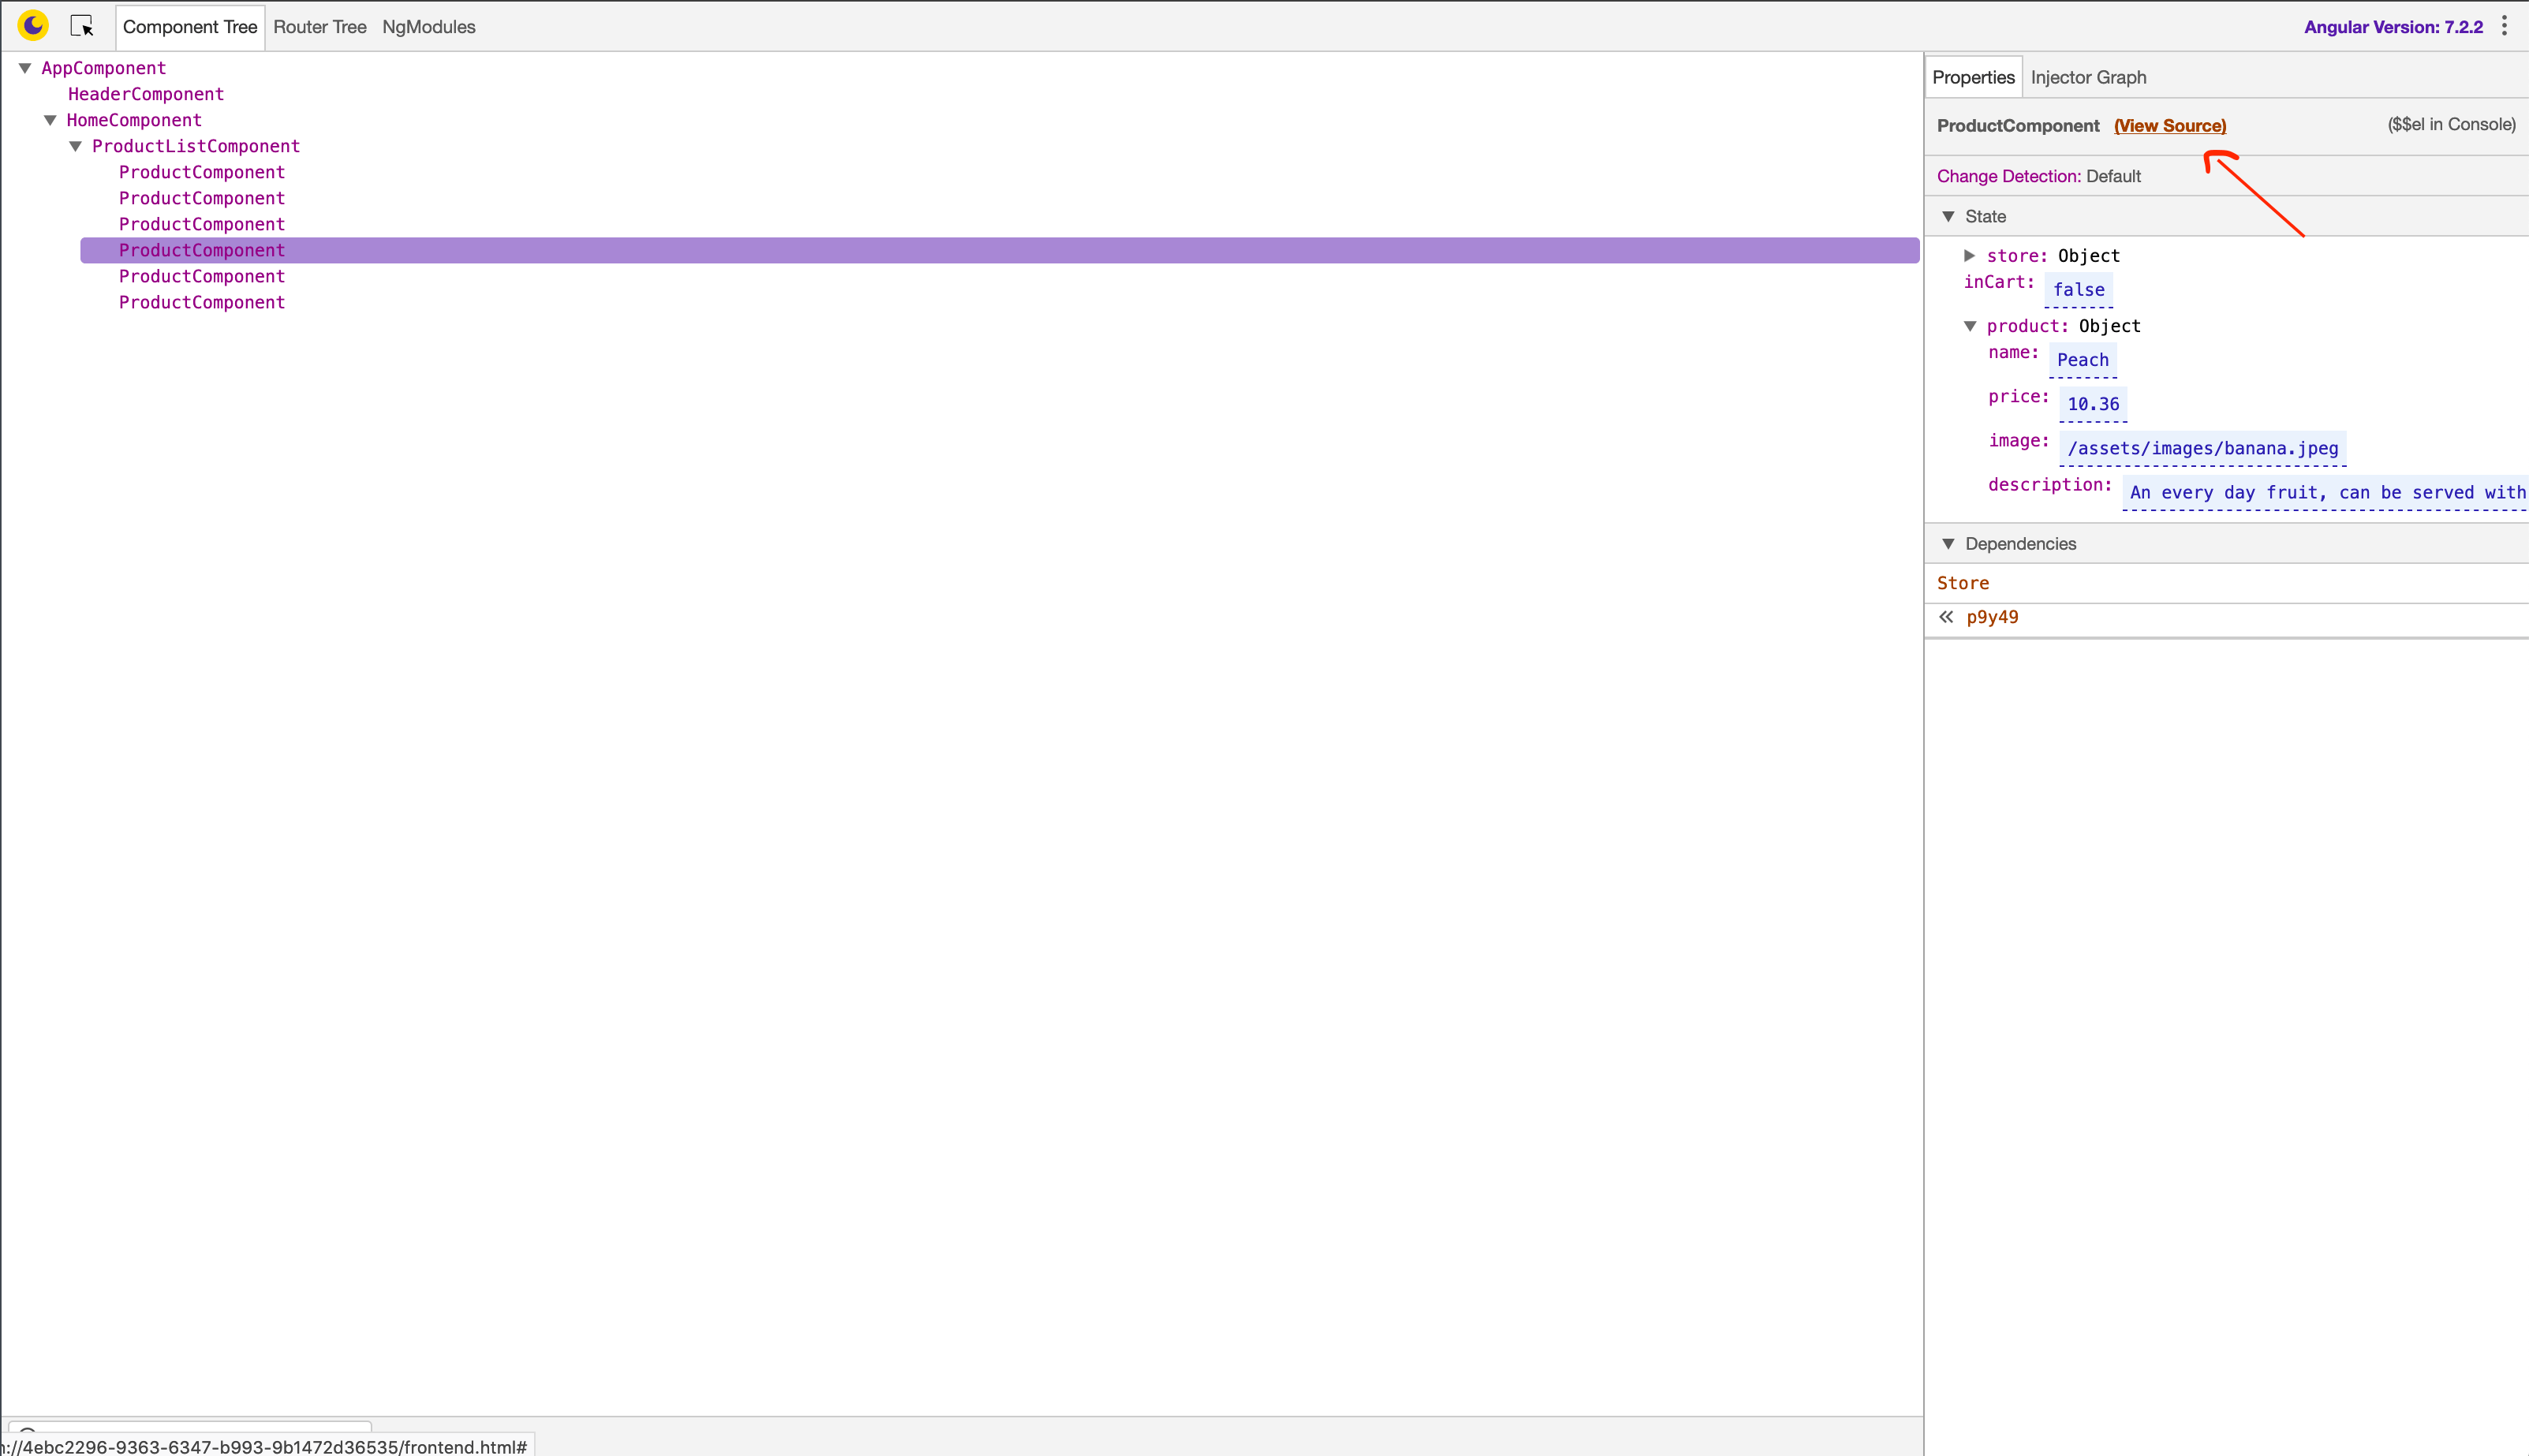
When the view source button is clicked, the source for component is displayed, showing the methods, state and data bound to the component.
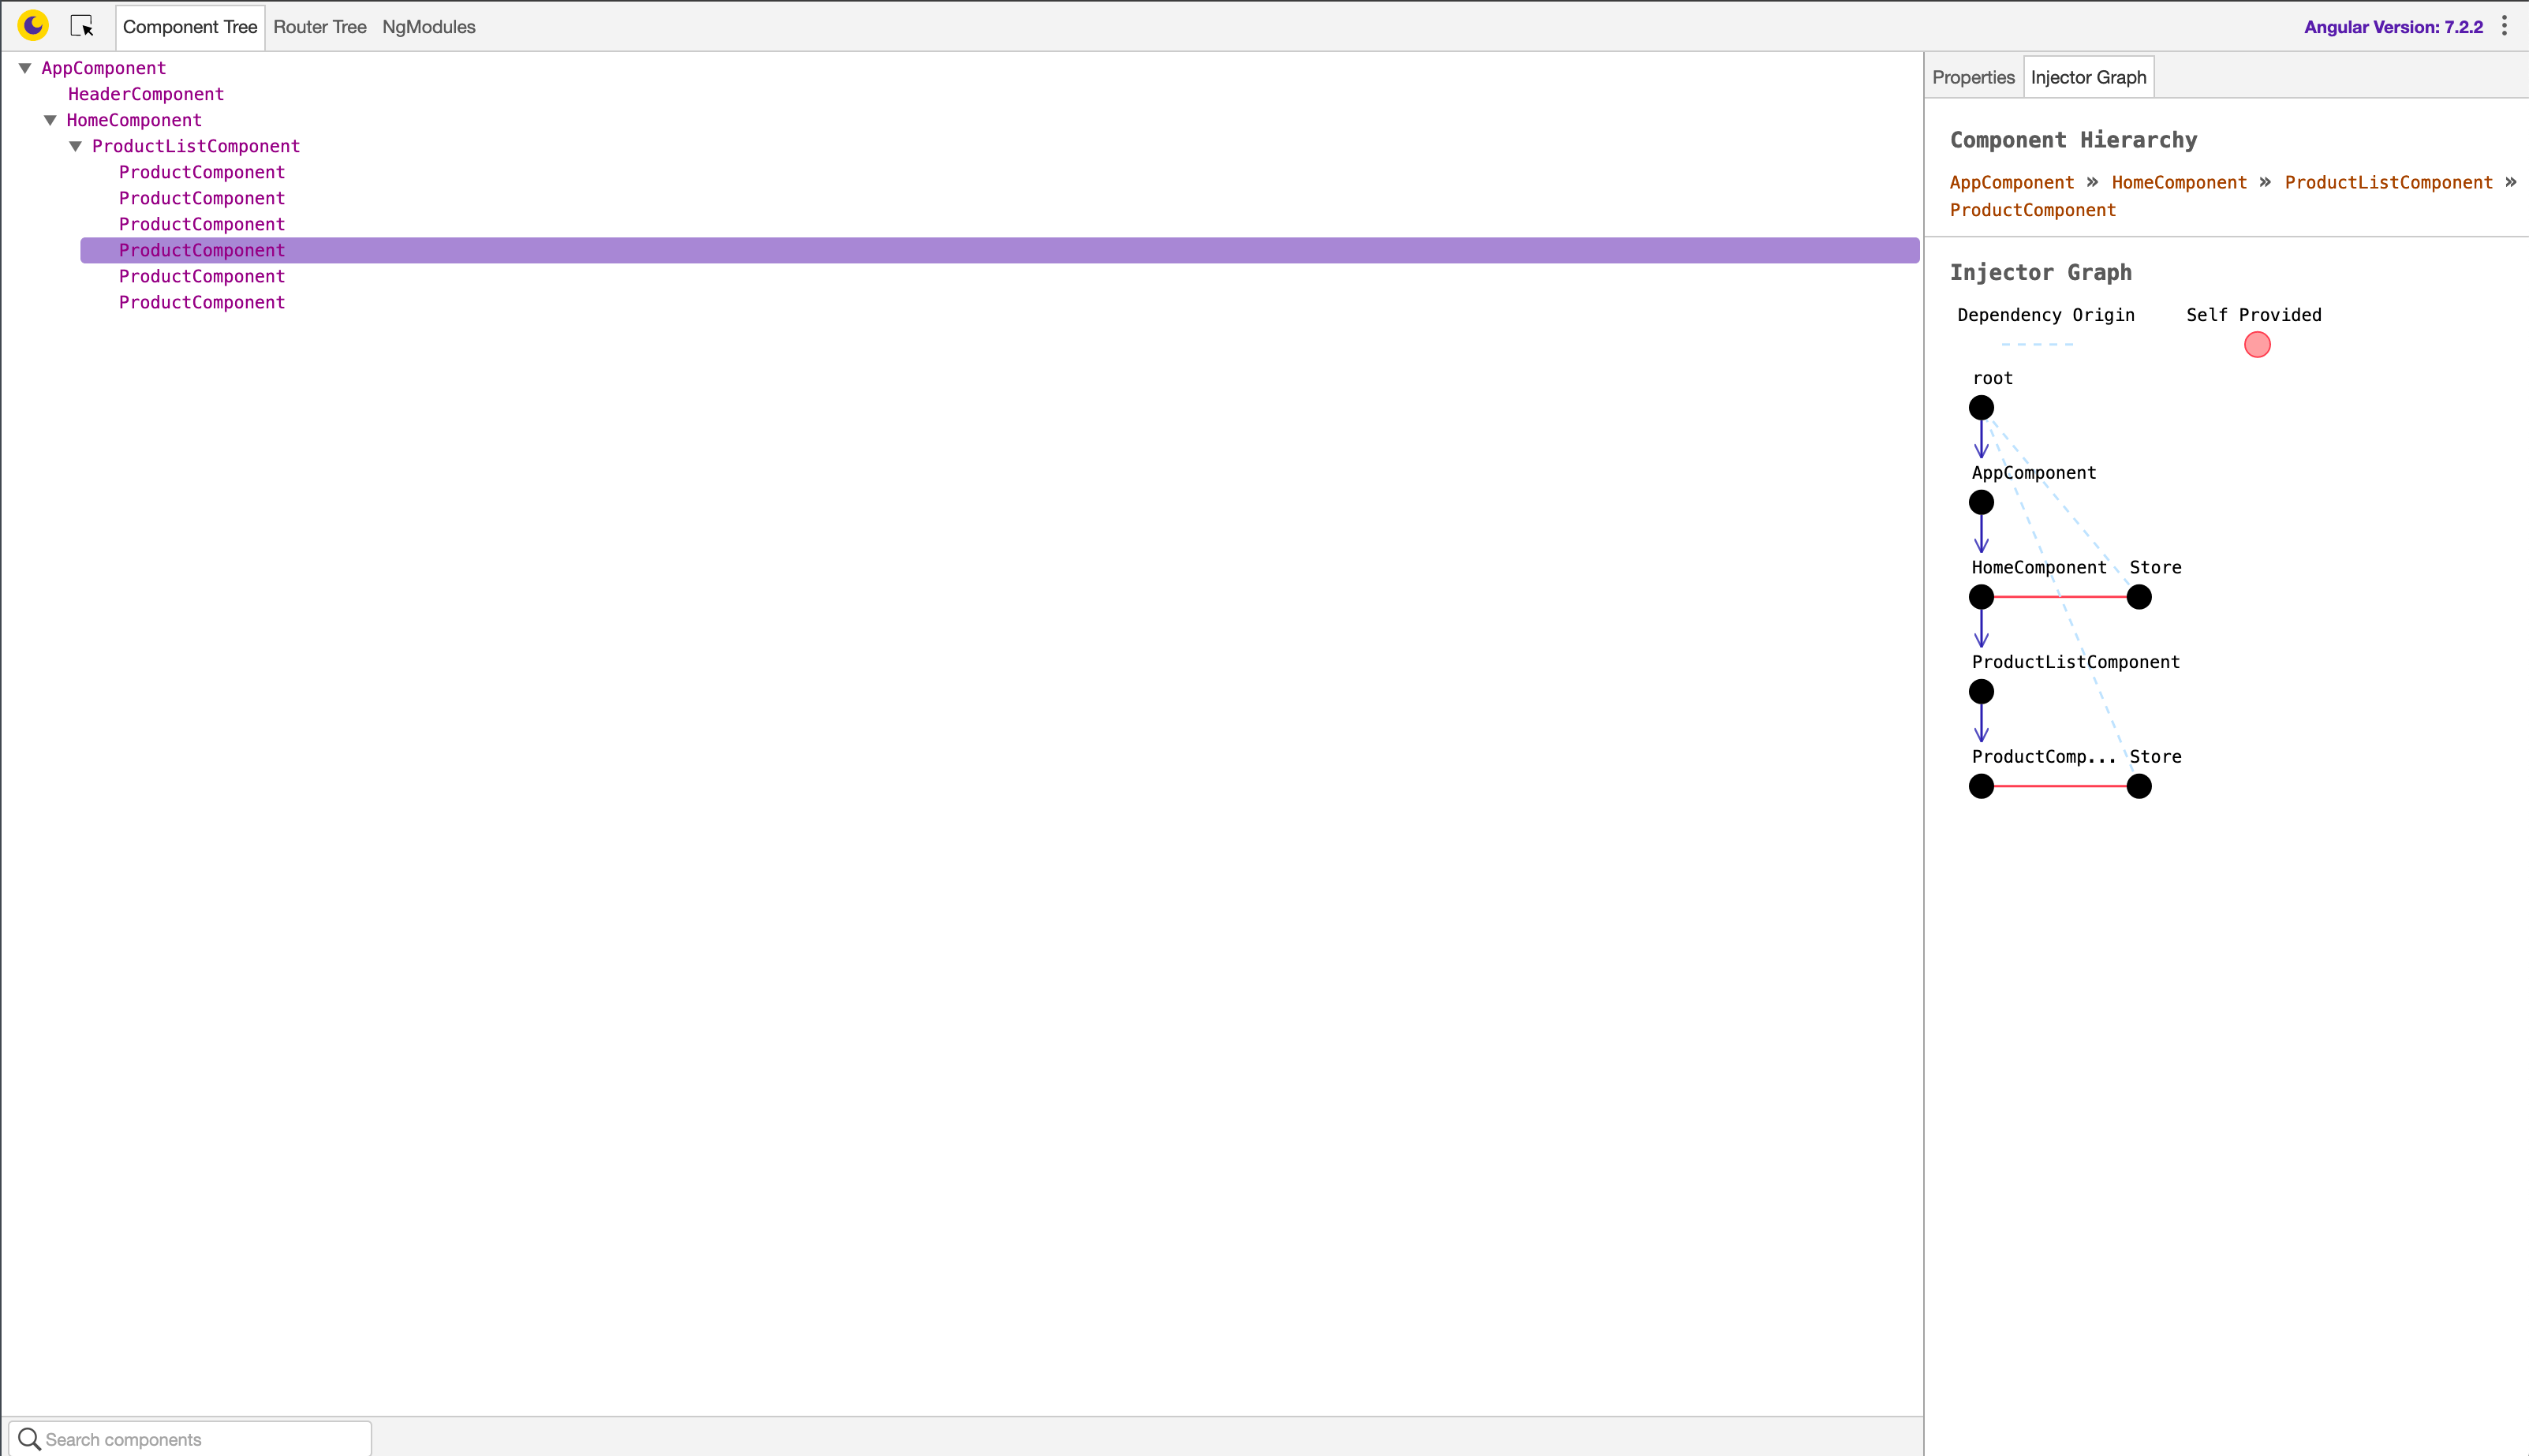
The component hierarchy and the component’s dependencies can be viewed in the Injector graph tab.
Debugger
Using the debugger statement in any area in your codebase will cause the application to break at the point where the statement is set. This is useful for viewing the current call stack of your application before the breakpoint was set.
For example, if we need to see the data being passed to a function, we place the debugger statement at the entry point of the function:
addToCart(item) {
    debugger;
    this.store.dispatch(new AddToCart(item));
    this.inCart = true;
 }
You can then view the data sent on each function call.
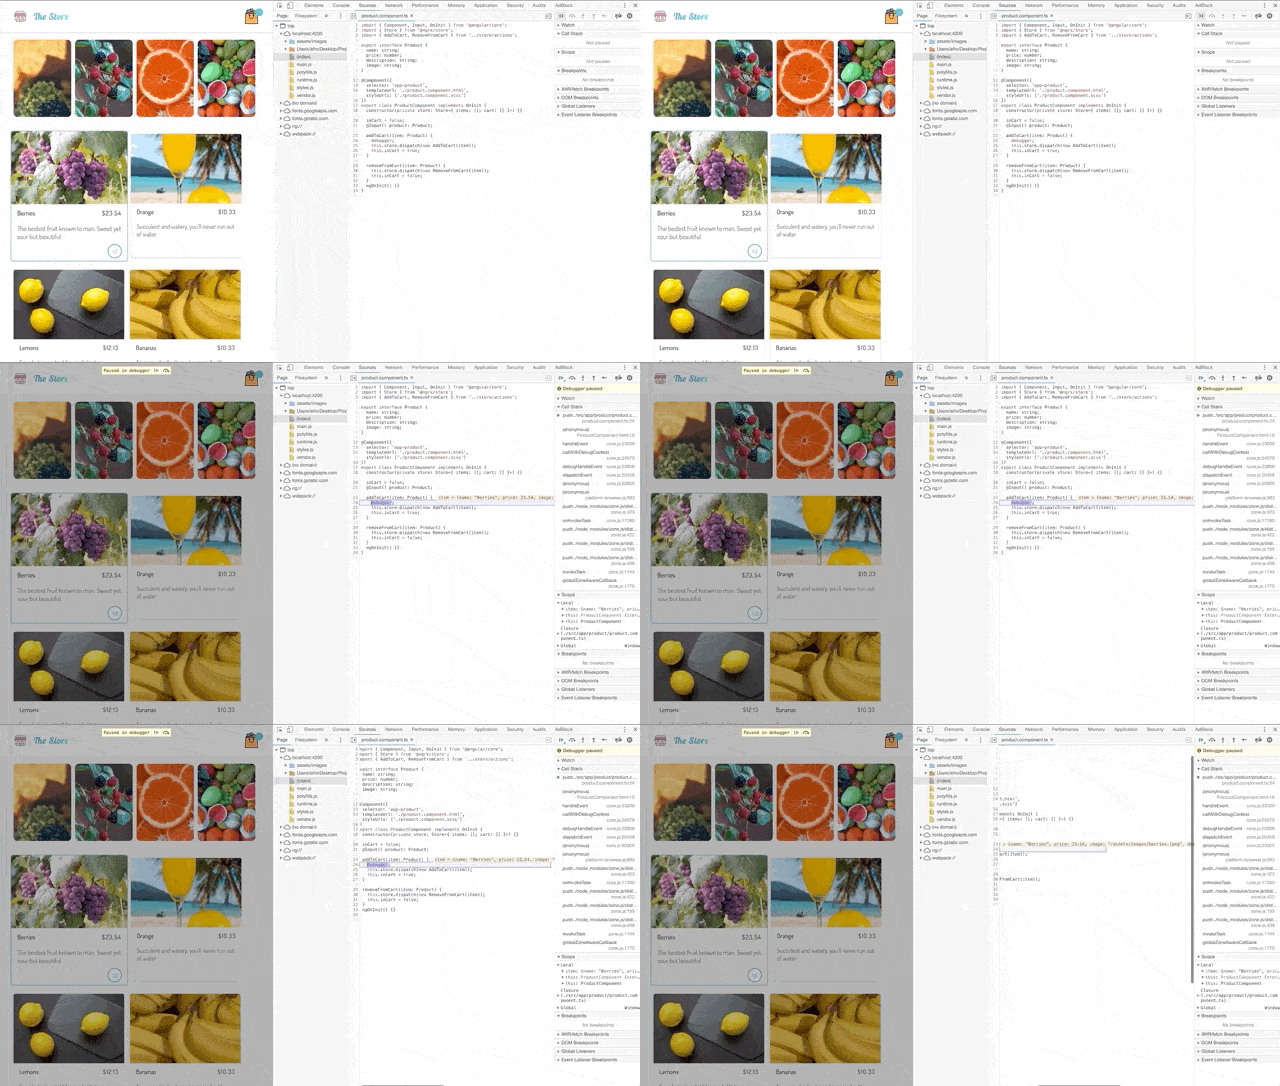
When using the keyword in the Chrome DevTools, you can view the current values at the point the breakpoint is triggered. This is very useful when debugging, as you can see what parameters are being passed to a function or returned from a function without logging them.
ng probe
This is a useful DevTools command for viewing the current state of any component within the component tree. To make use of the command, visit the DevTools. In the Inspector tab select any Angular element, then navigate to the console tab and run the following command:
ng.probe($0).componentInstance
The ng.probe function takes a single parameter: $0; this is a DevTools shortcut for viewing the last selected element on the Inspector tab. Other parameters that can be passed to ng.probe are: $1, $2, $3, $4, each signifying the last four selected elements in the Inspector tab.
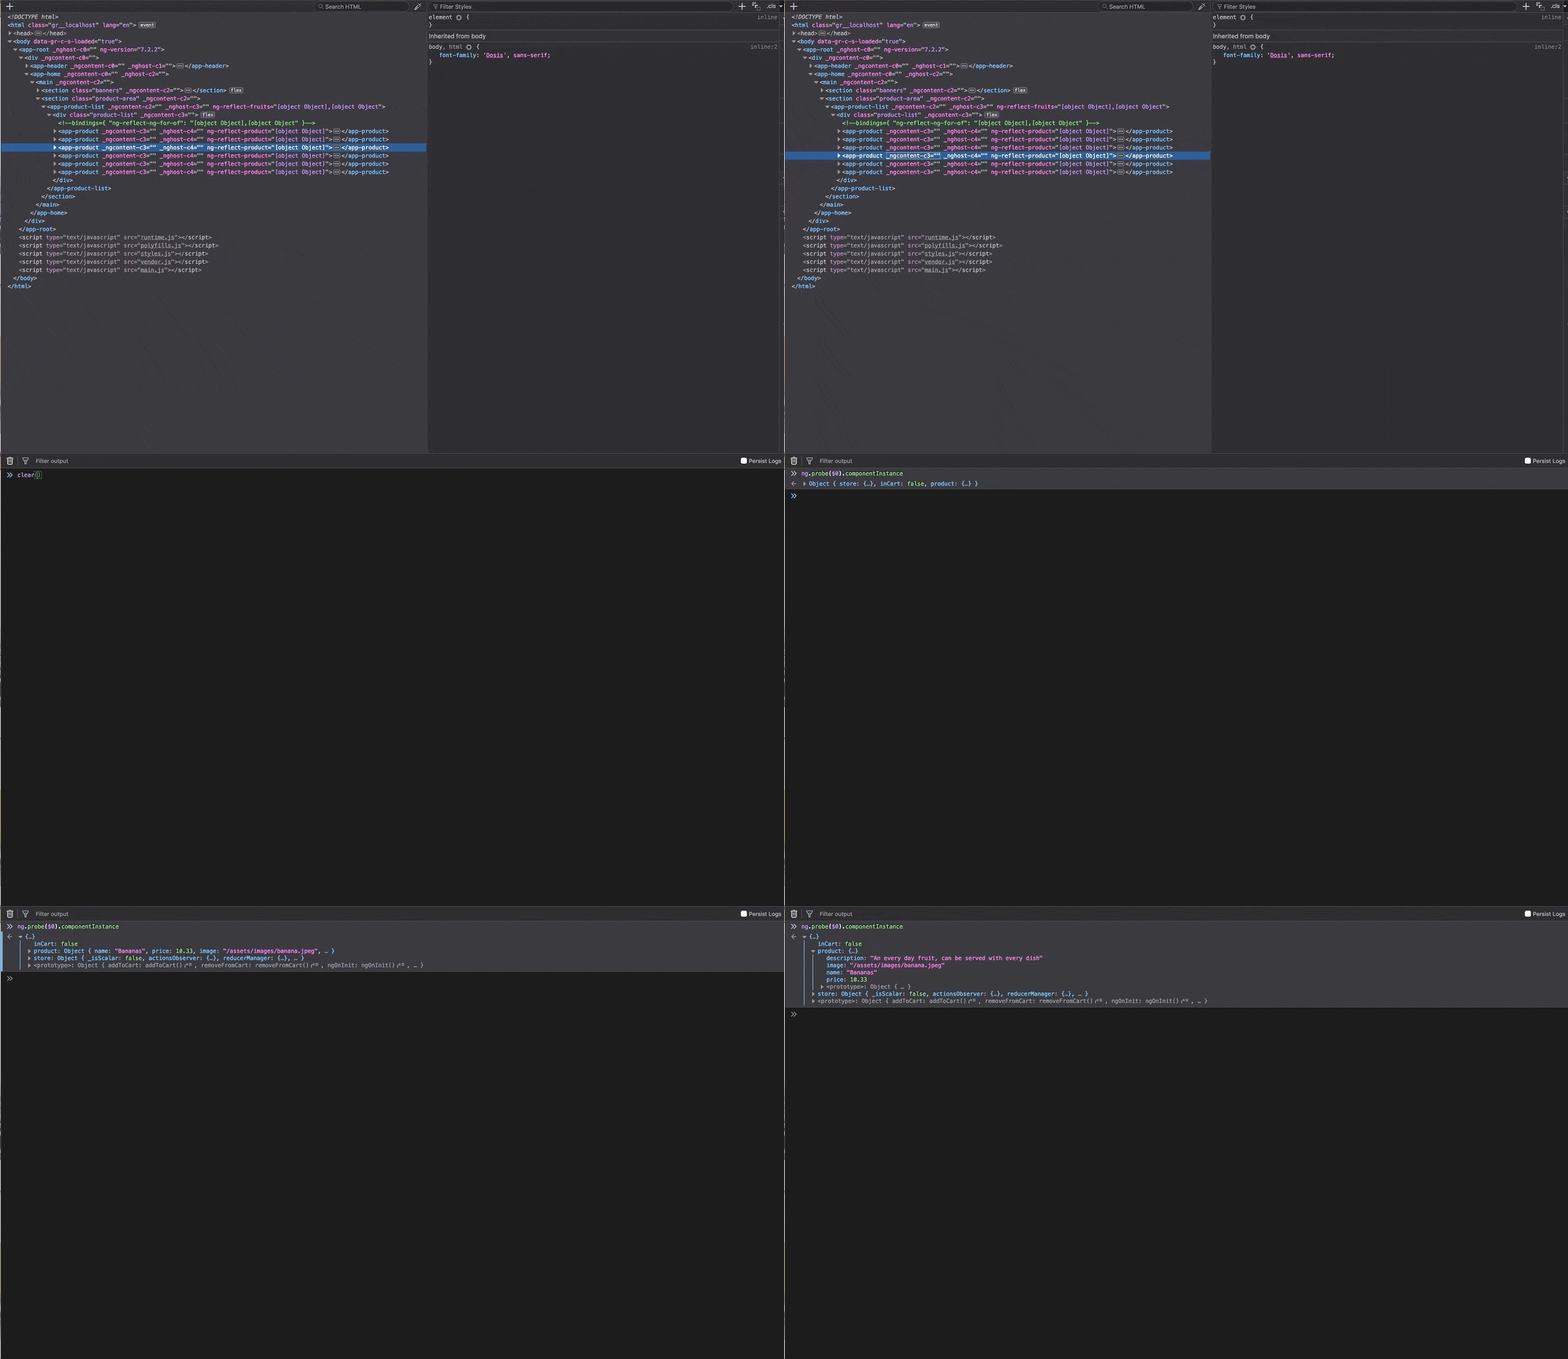
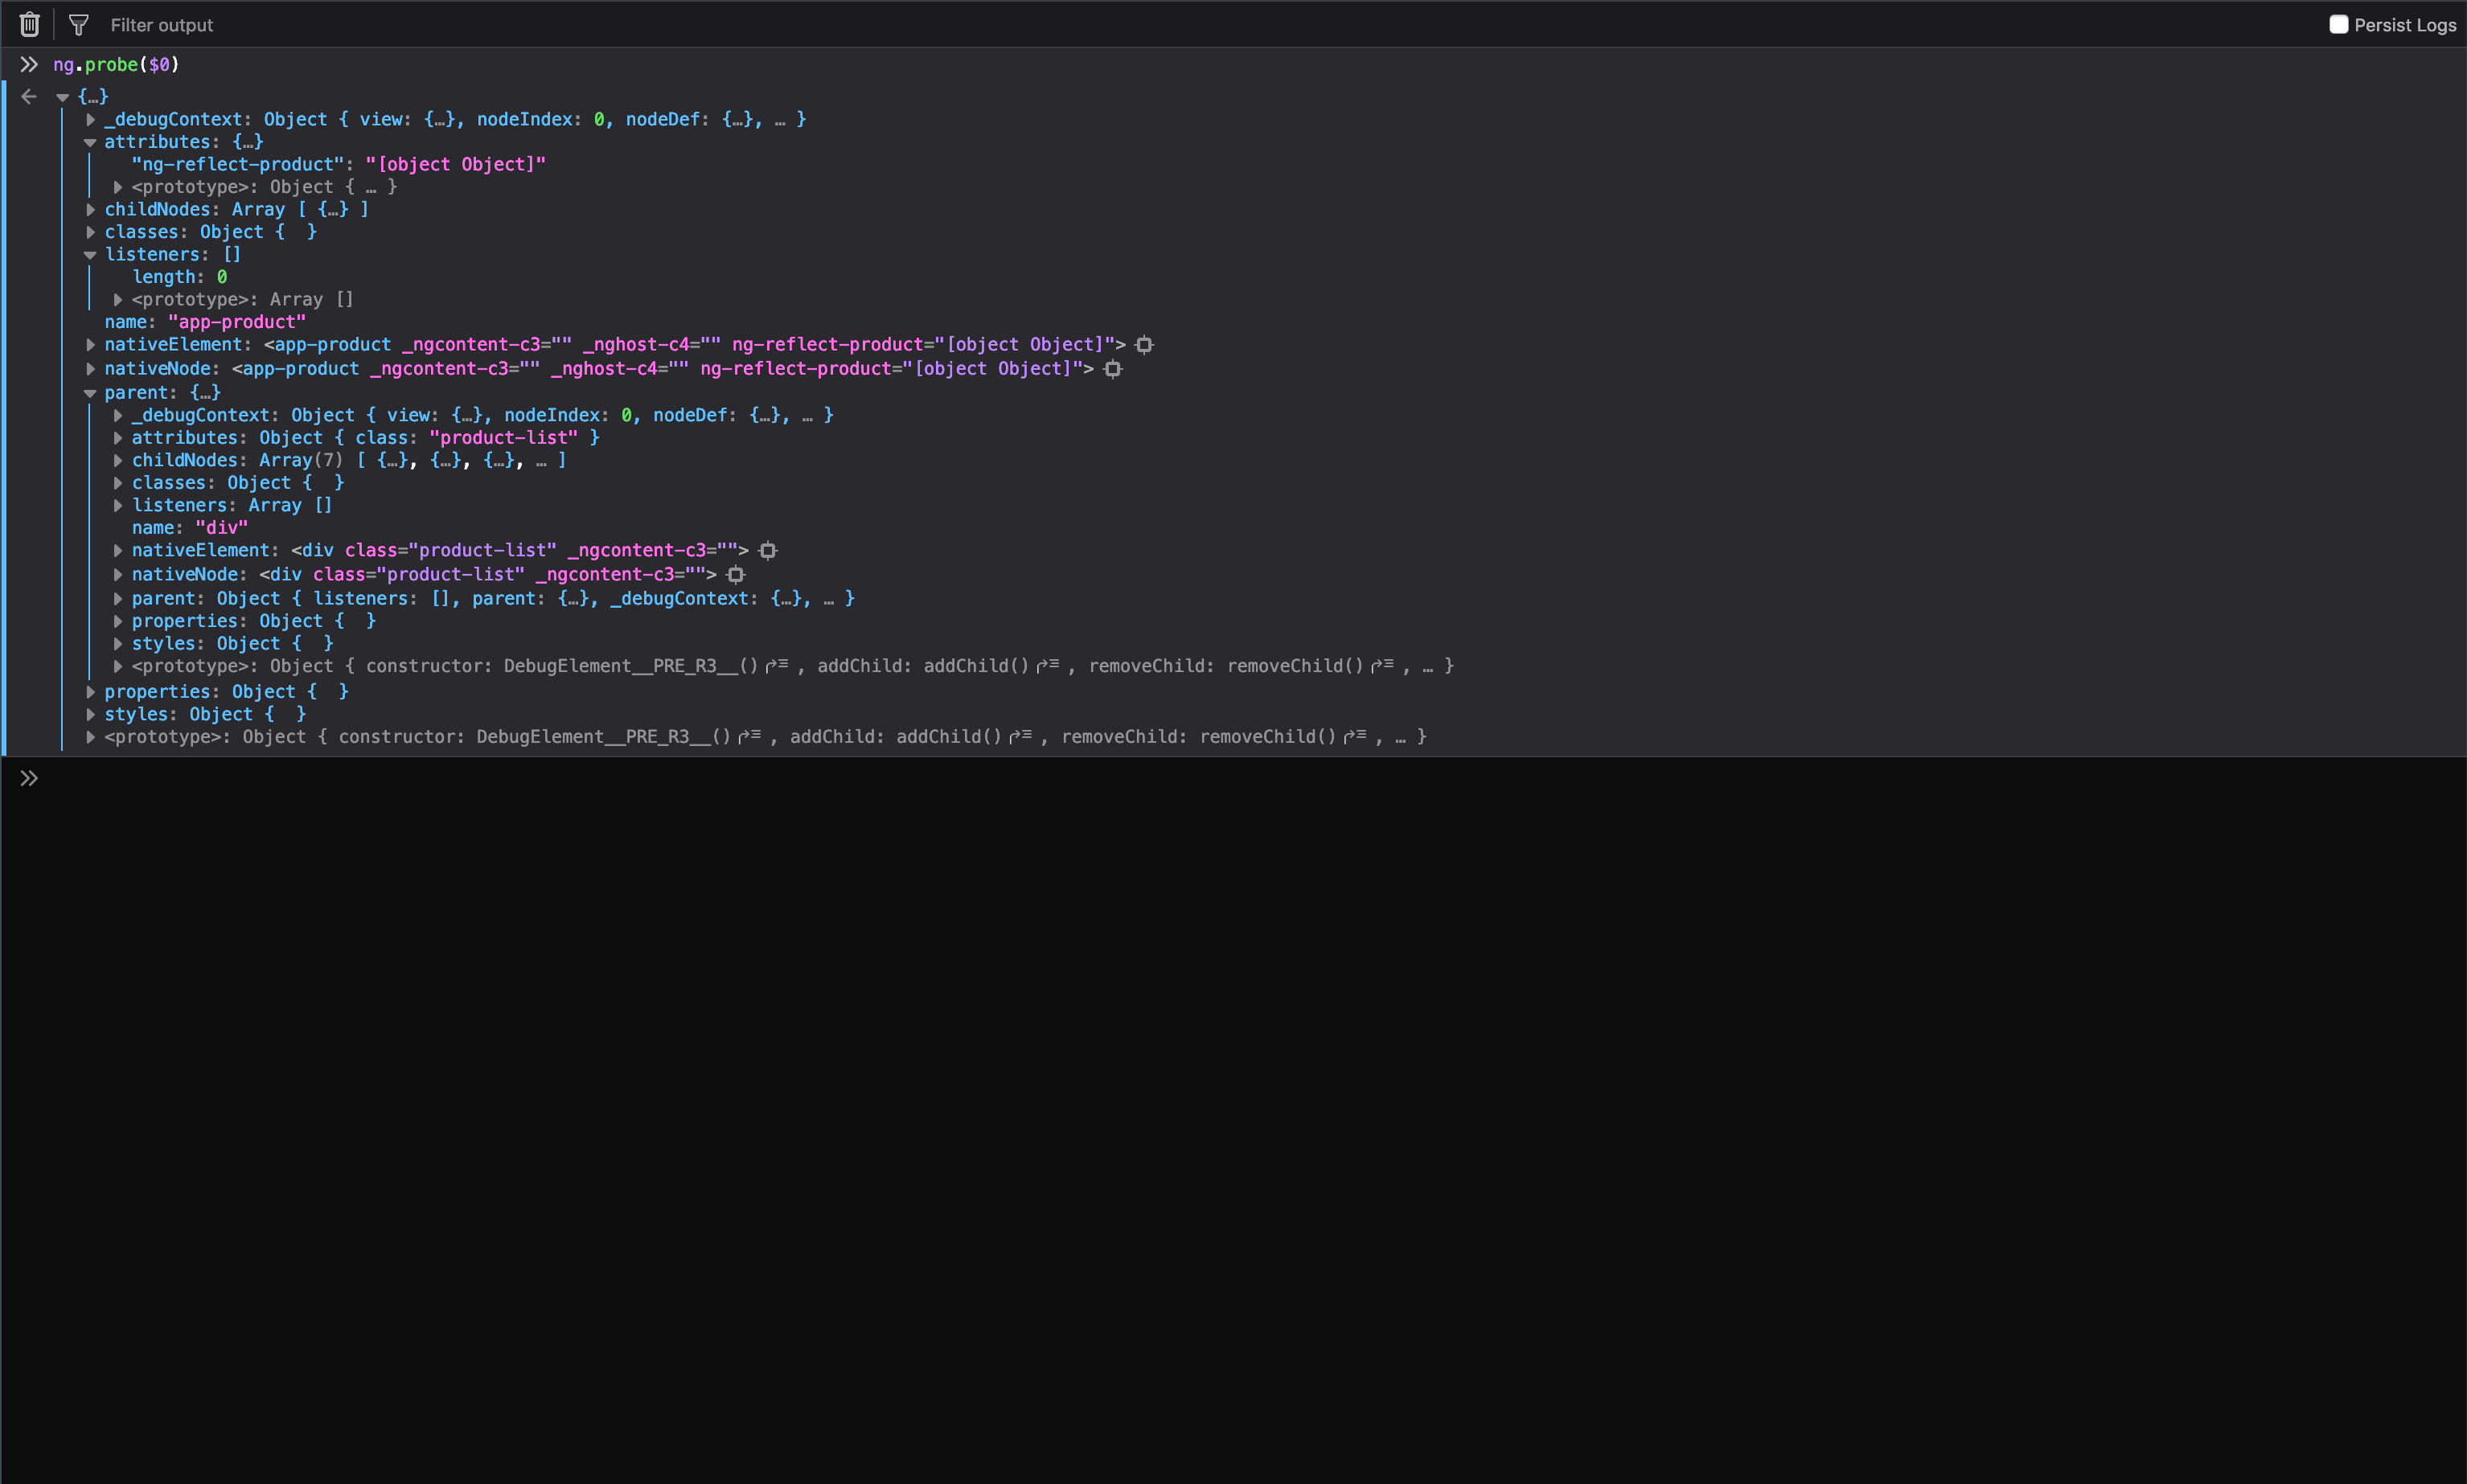
You can view other information about the component like the listeners attached to the element, the parent element and the element’s attributes using the ng.probe($0) call.
Editors
Debugging using the DevTools is great and all, but nothing really beats the comfort of never leaving your editor/IDE. Editors and IDEs like VS Code and WebStorm can be configured to debug Angular applications. To get started in VS Code, the first step is to install the Debugger for Chrome extension. You can search the extensions tab and it’ll pop up:
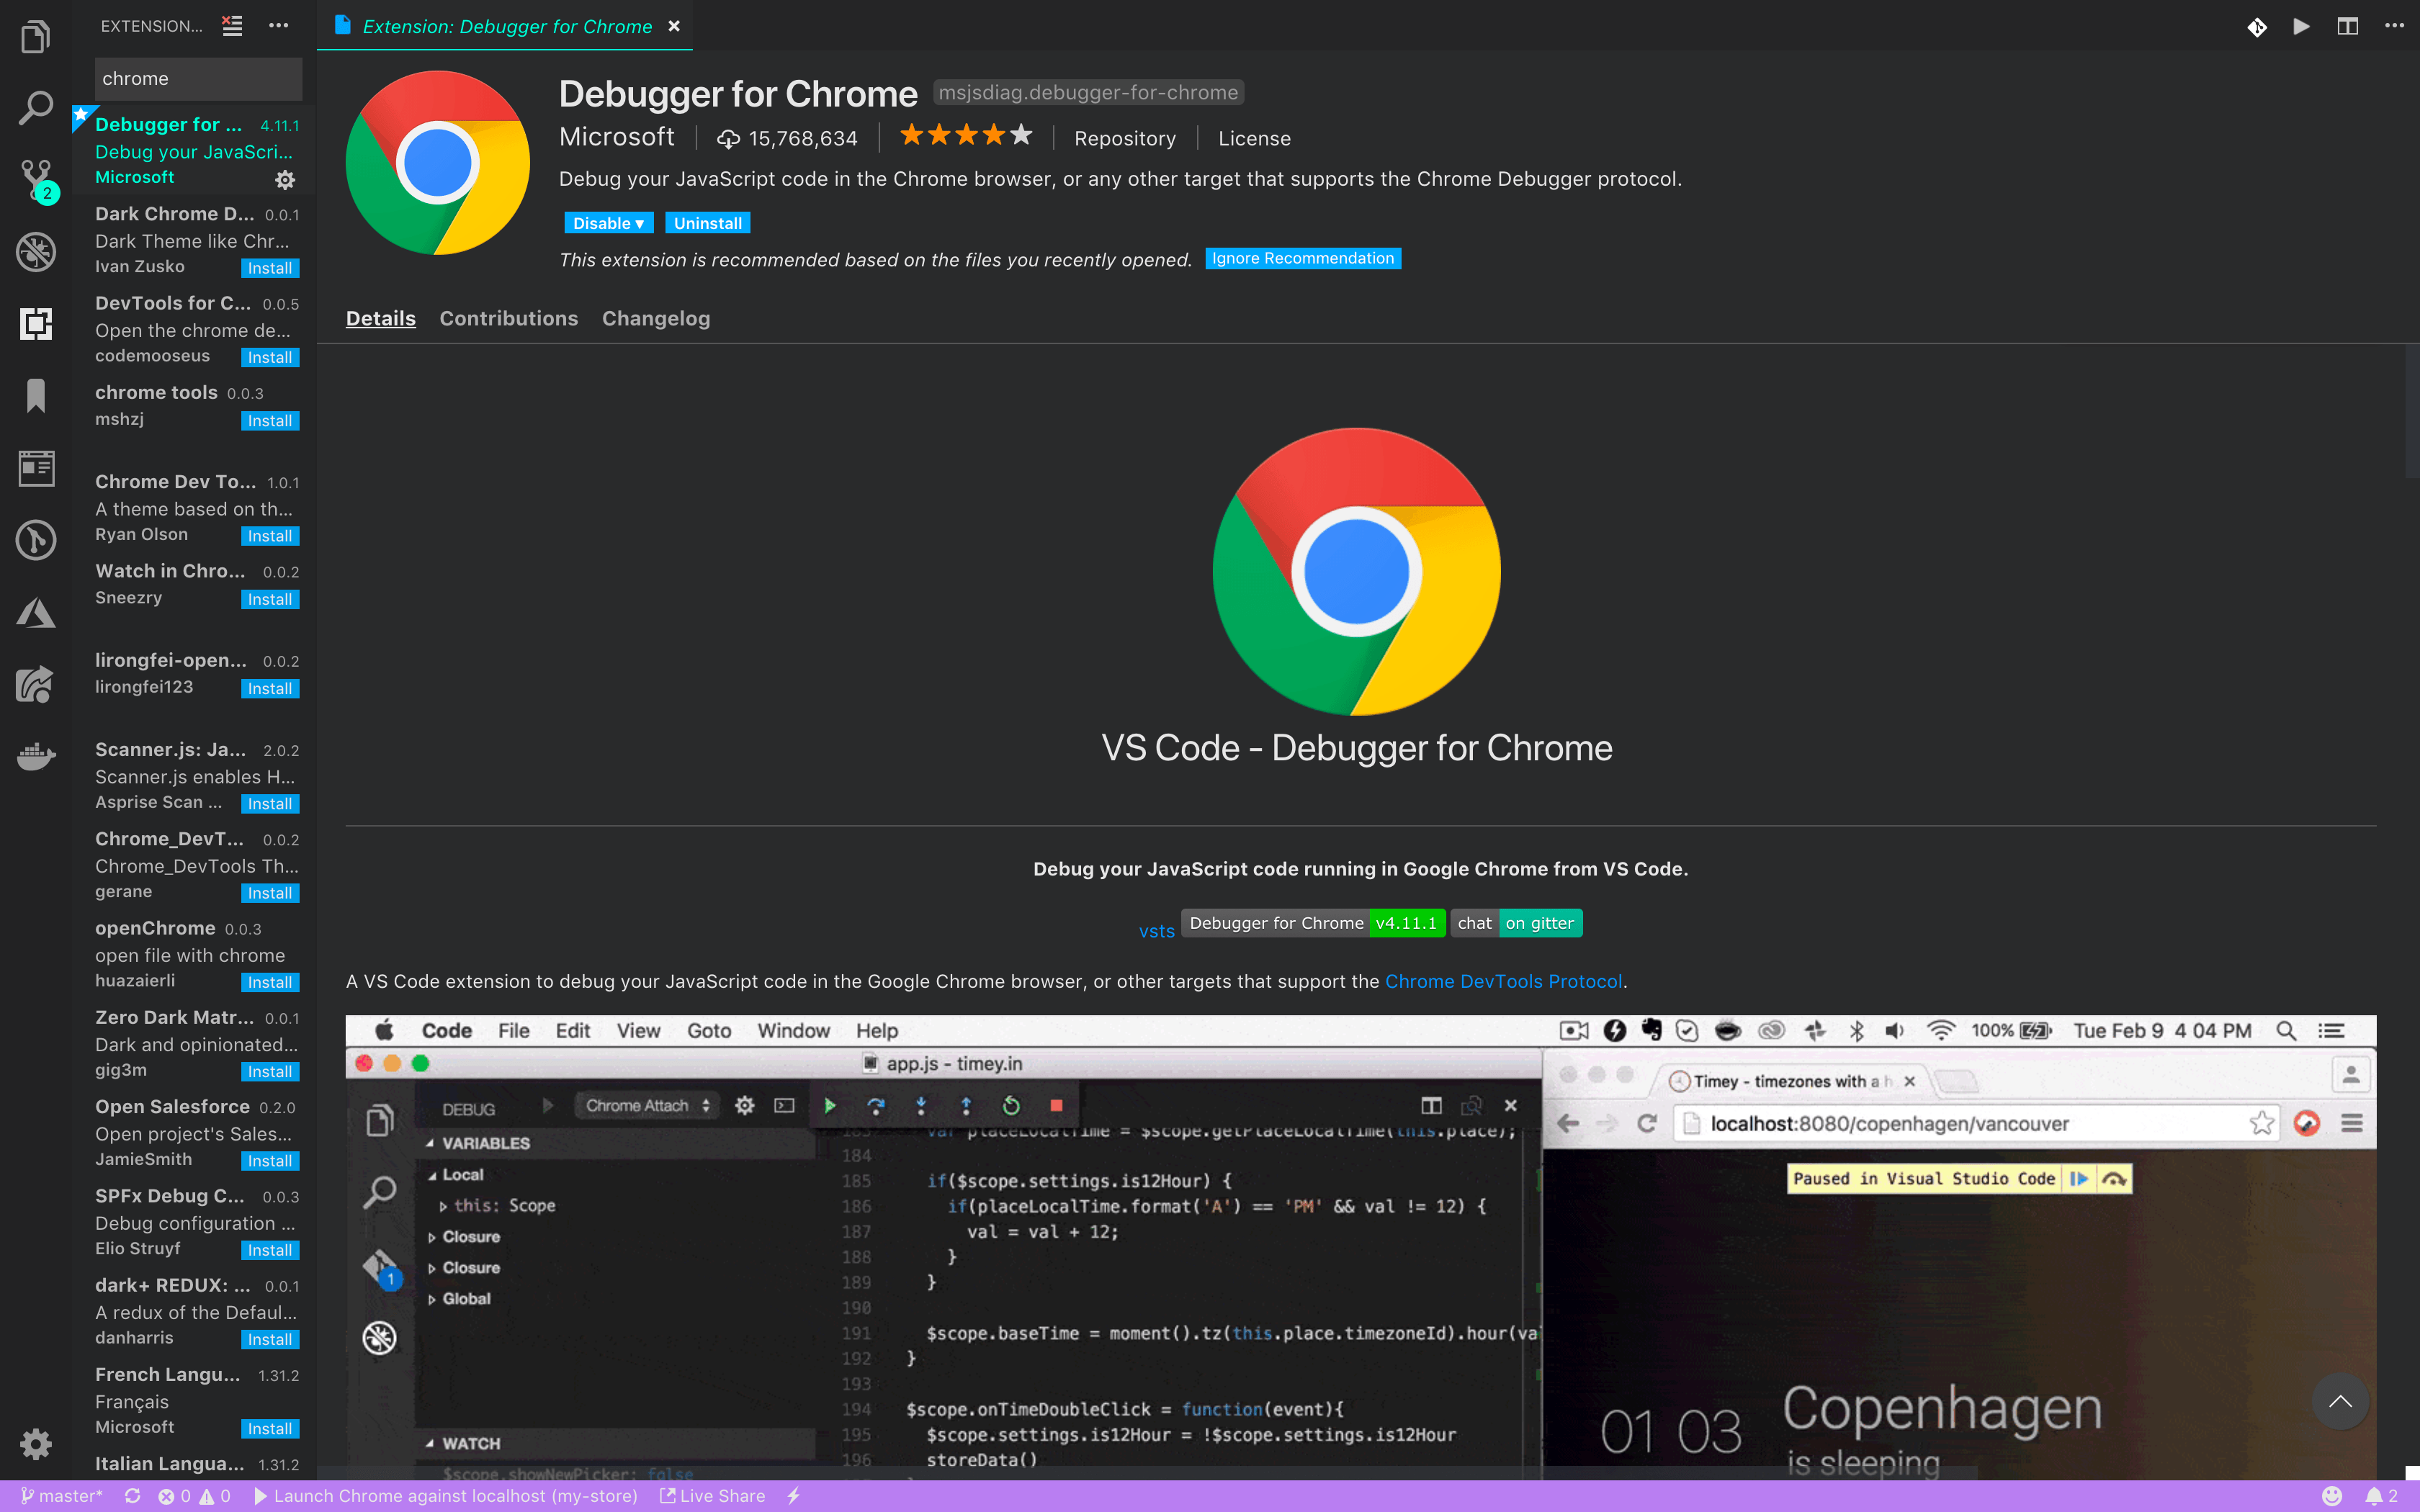
If the extension hasn’t been installed previously, you should see an install button right where the uninstall button is in the screenshot. When installation is complete, reload the editor window.
Next step is to configure the launch script: launch.json. VS Code has several presets, so you really don’t have to worry about writing from scratch. Go to the debug tab on the side bar, the one with the bug icon. In the debug tab, click on the gear icon and select the chrome preset. This will generate a launch script, and all you need to do is edit the url property to fit the port your application runs on.
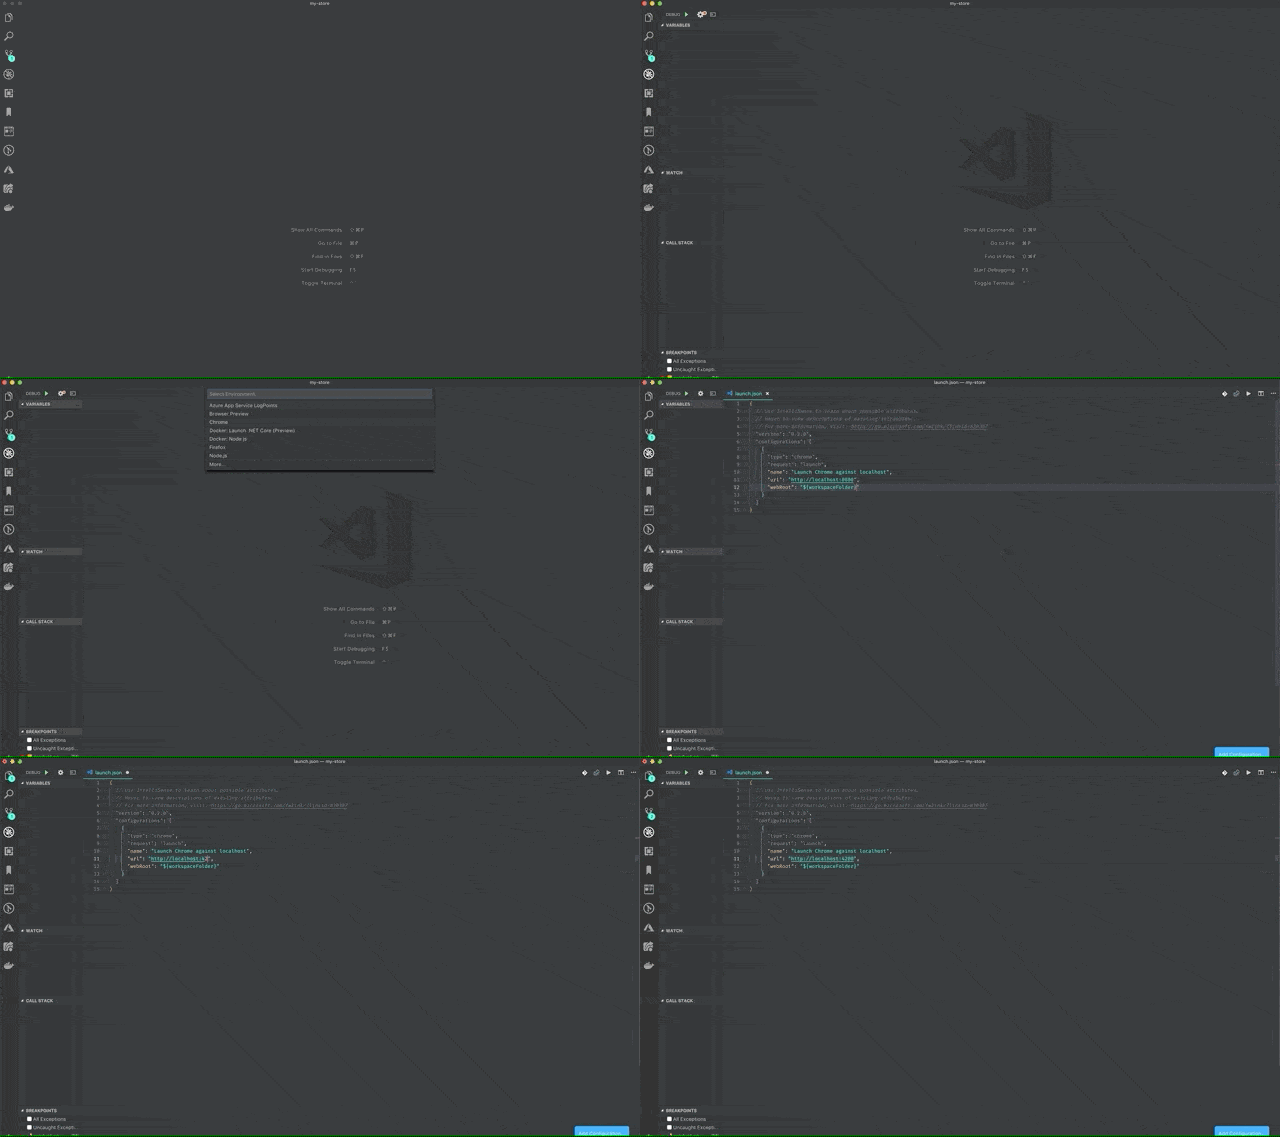
Your final launch script should look like the screenshot below.
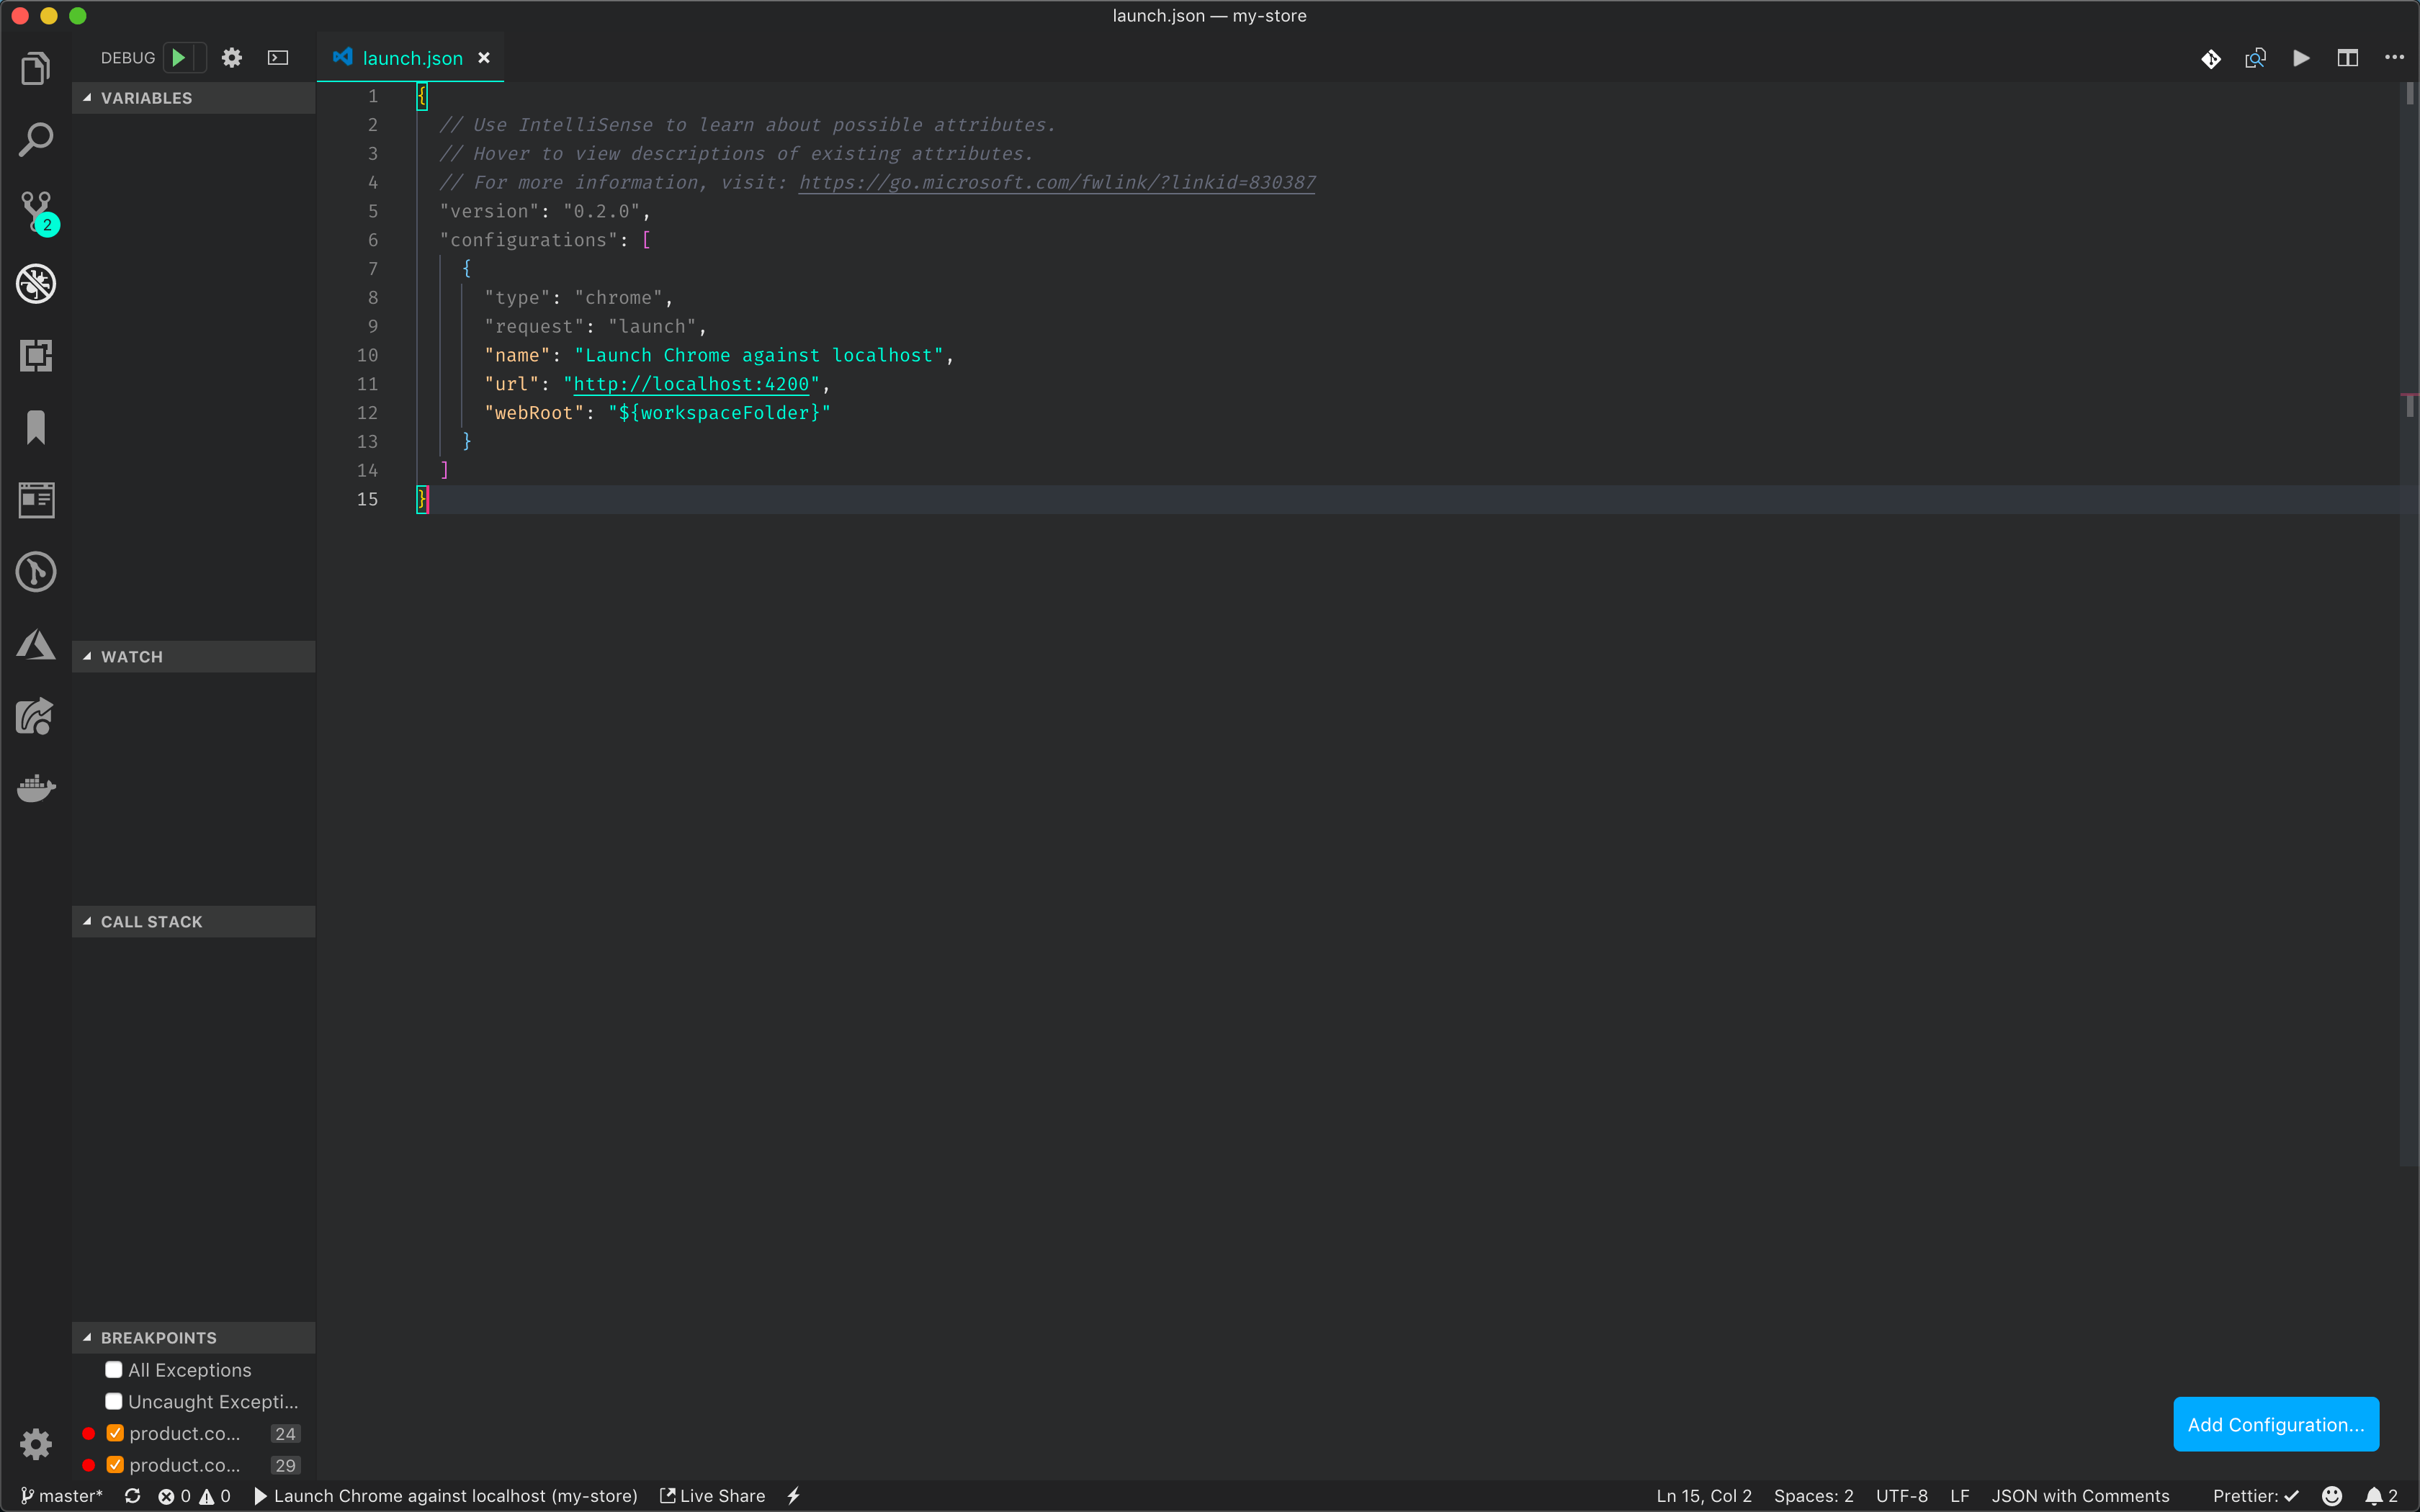
Now you get to set breakpoints throughout your codebase, and the breakpoints will be observed in Chrome.
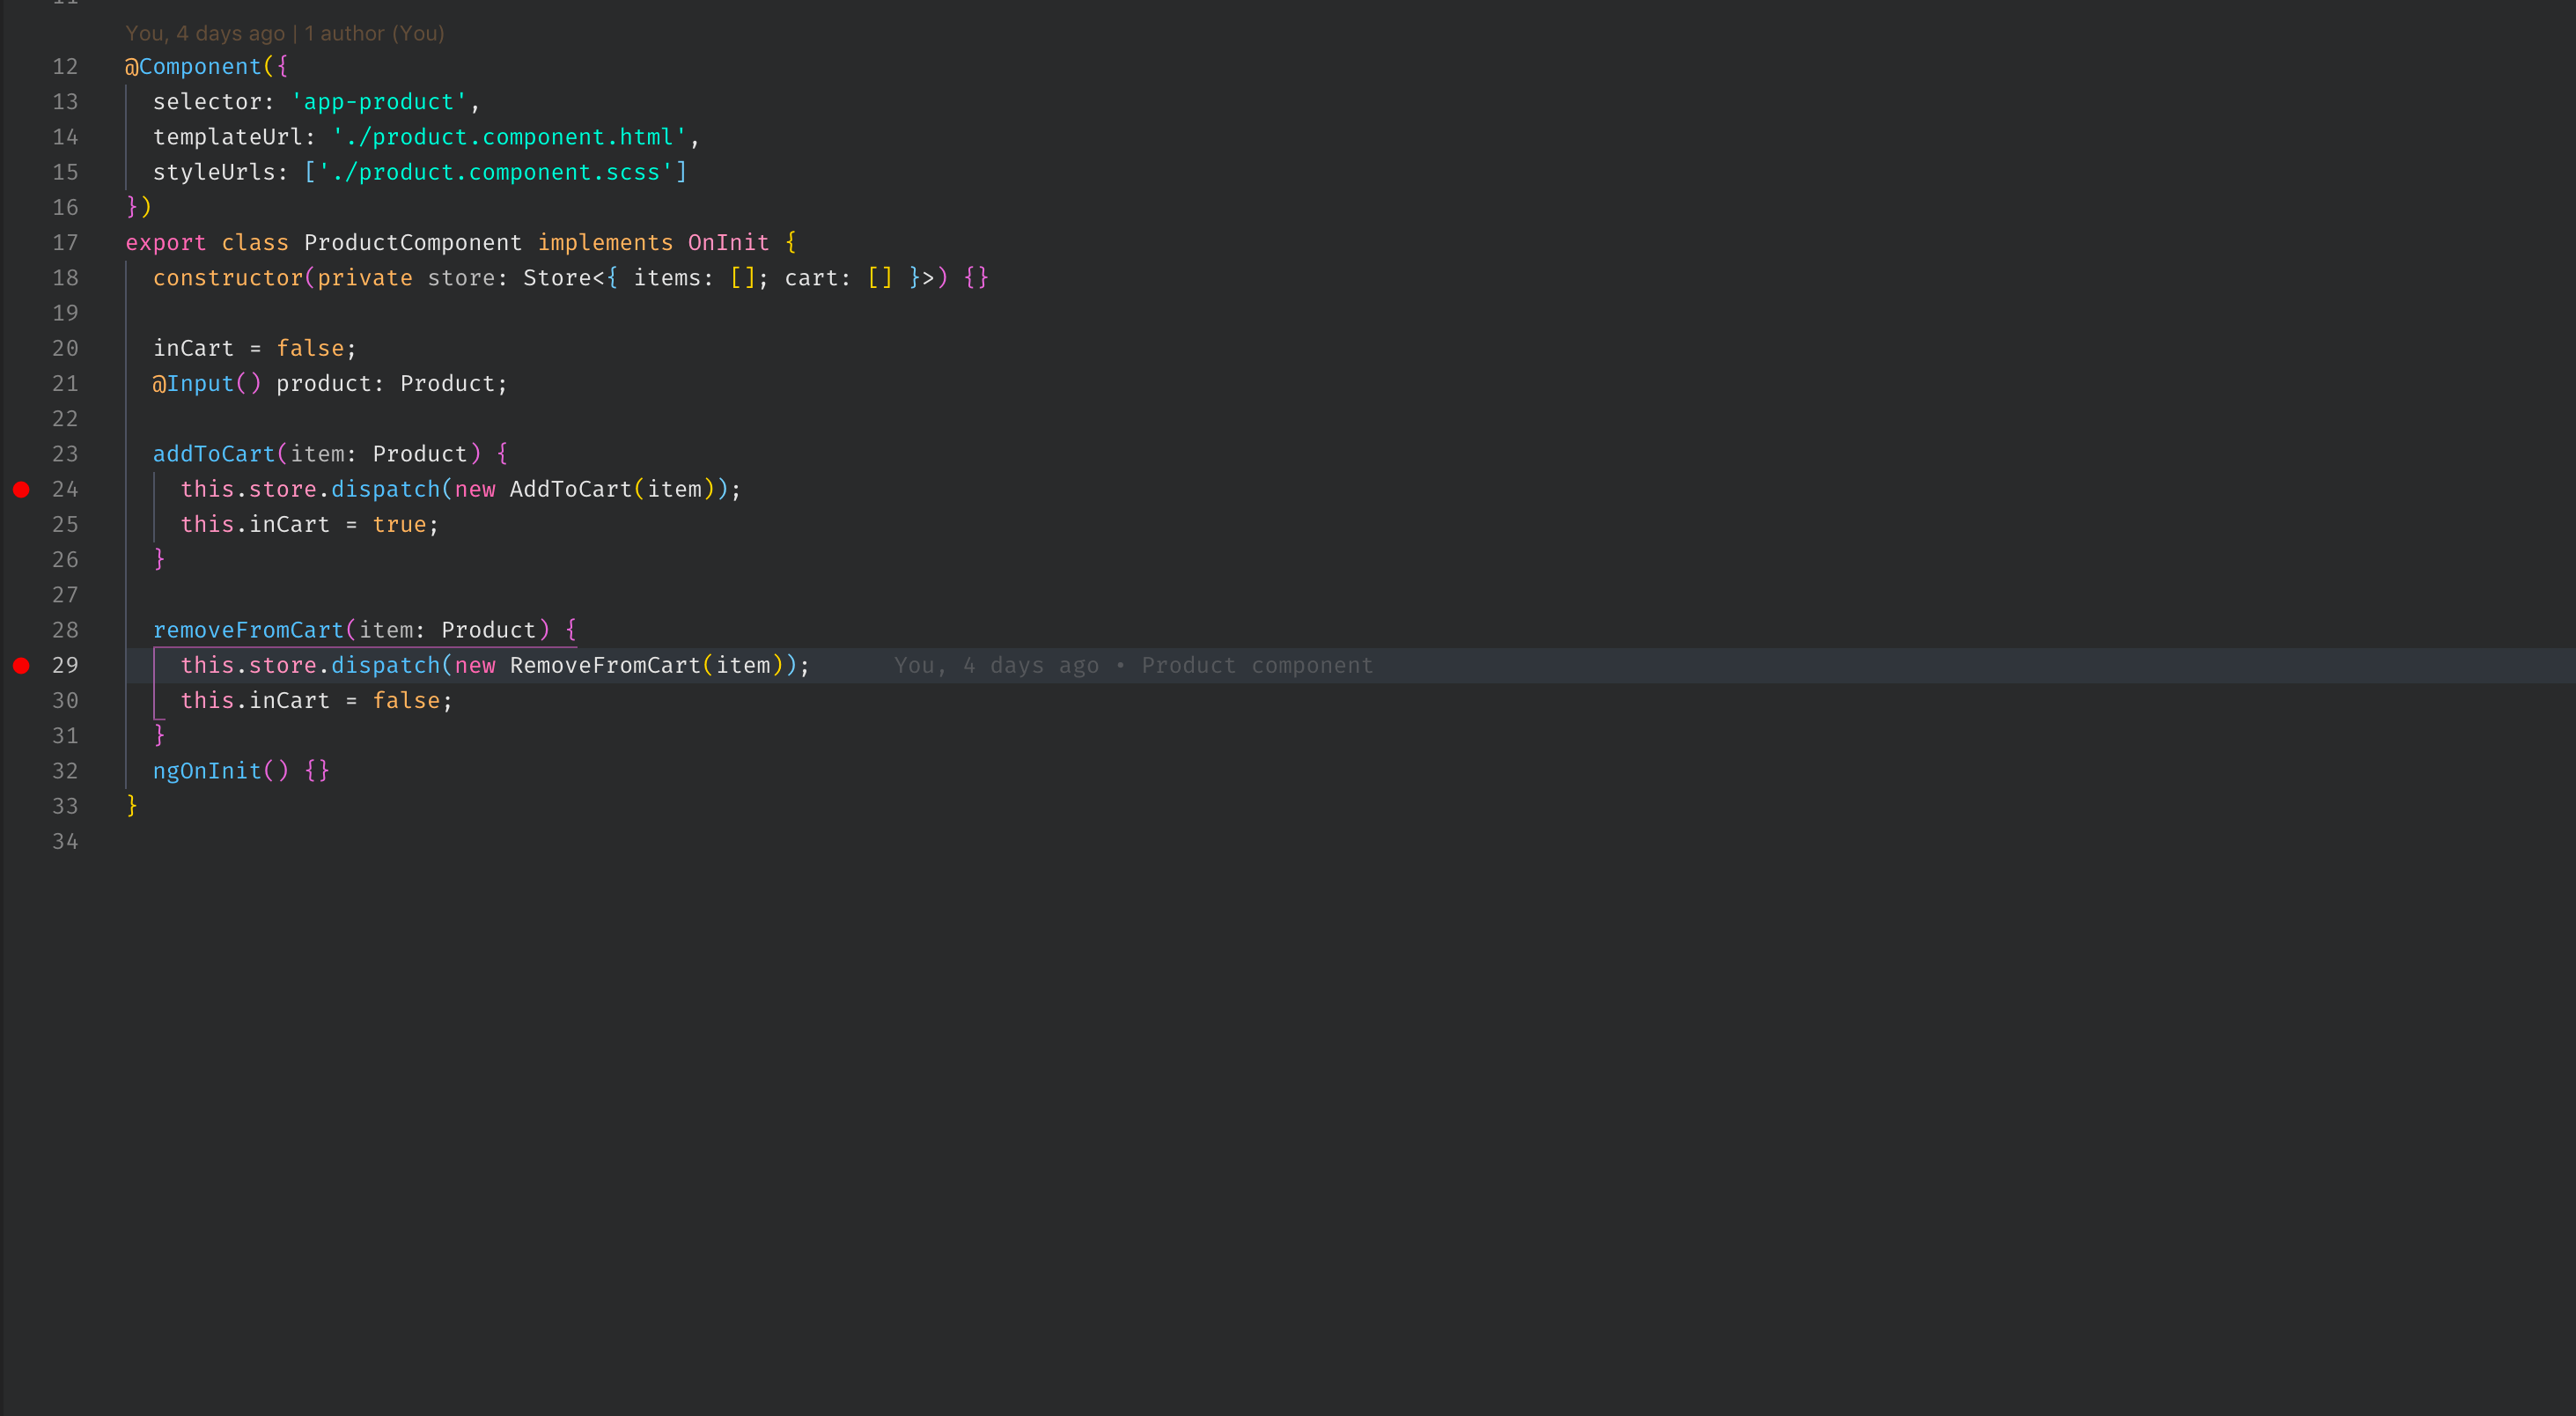
The breakpoints will be triggered when an item is added to cart. When this happens, the window focus will be shifted to your editor and you can inspect the values right from your editor.
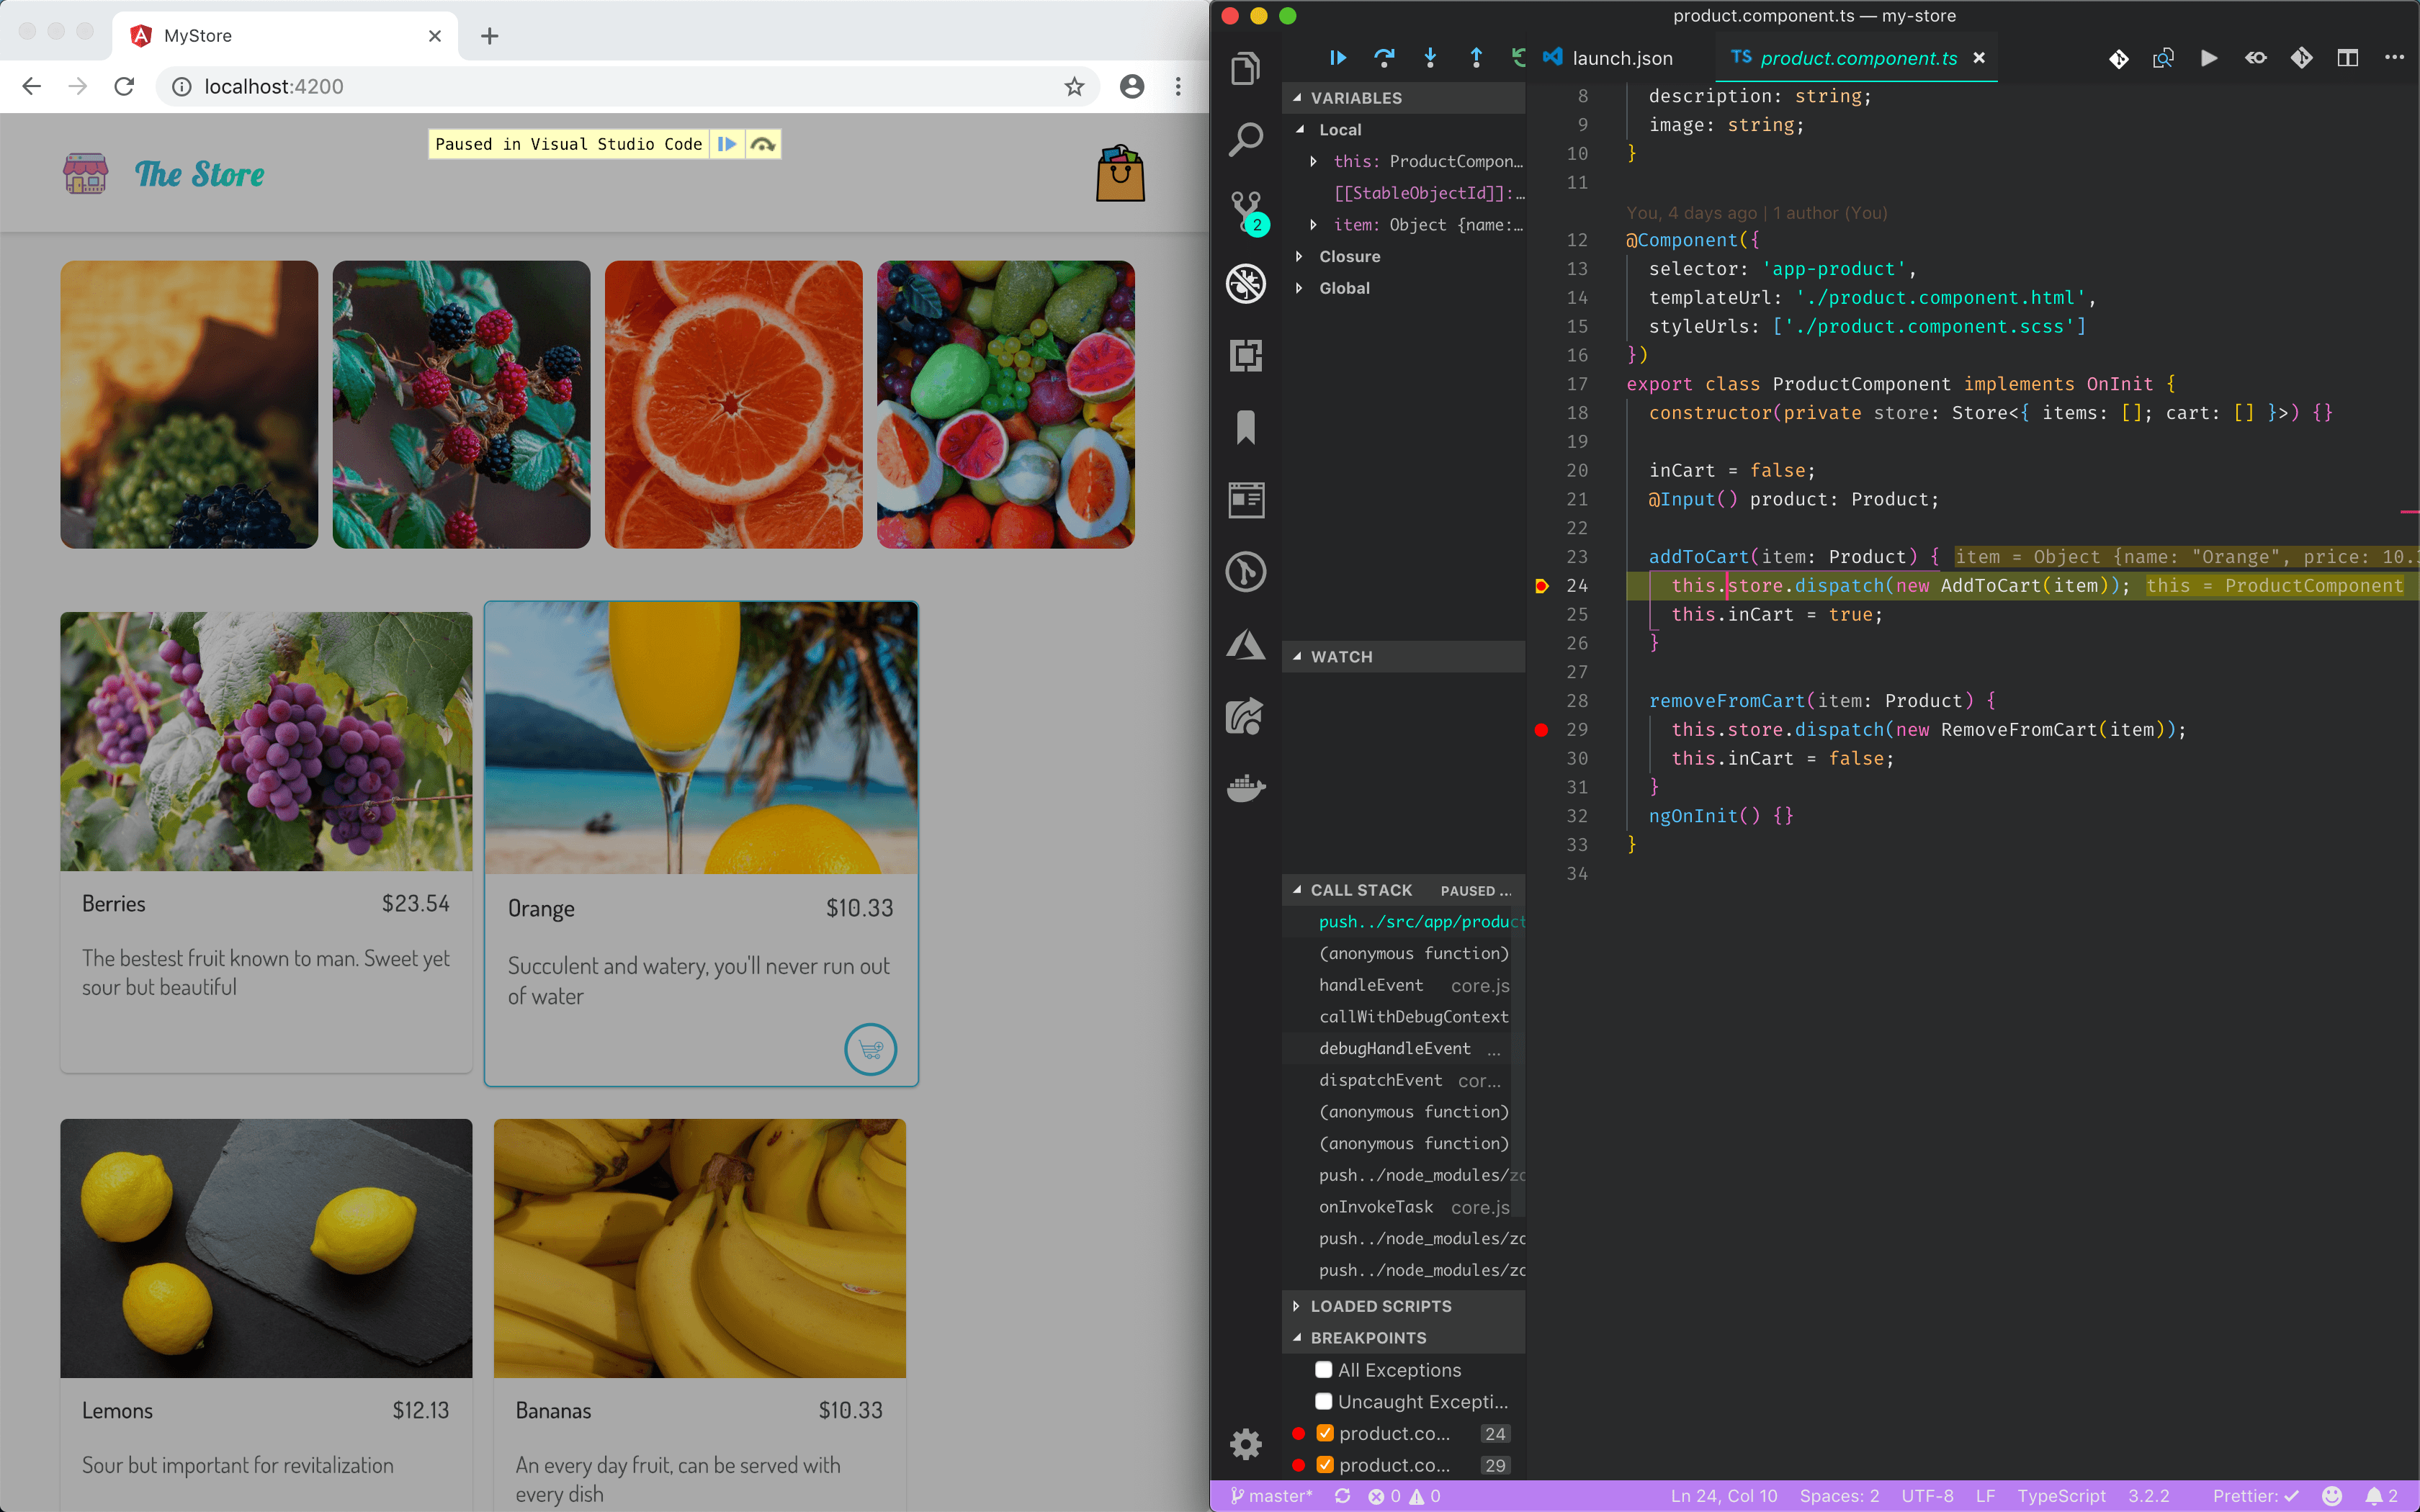
You can also make use of the debug console on the editor like you’d do in the DevTools console.
Tap
Debugging observables is knowingly tricky—you never know what value will be passing through, especially when piping operators. Well, RxJS has introduced the tap operator, previously named do (renamed due to naming conflicts with the JavaScript keyword). It can be placed between piped operators to transparently perform side effects like logging the values piped through it.
    import { of } from 'rxjs';
    import { tap, map } from 'rxjs/operators';

    const evens = of(2, 4, 6, 8);
    const divisor = evens.pipe(
      tap(val => console.log(`BEFORE MAP: ${val}`)),
      map(val => val / 2),
      tap(val => console.log(`AFTER MAP: ${val}`))
    );
When the divisor value is run asynchronously, both the current value and the transformed values are logged. tap doesn’t transform the values—this is done by the map operator; tap simply logs the values.
    BEFORE MAP: 2
    AFTER MAP: 1
    BEFORE MAP: 4
    AFTER MAP: 2
    BEFORE MAP: 6
    AFTER MAP: 3
    BEFORE MAP: 8
    AFTER MAP: 4
Profiler
Angular has a built-in profiler that records the amount of time it takes to run change detection throughout the application. It logs the amount of change detection cycle run throughout the application and the time taken for each check. To enable the the profiler, you have to enable debug tools in your Angular application. Update your main.ts file to be similar to the snippet below:
    import { enableProdMode, ApplicationRef } from '@angular/core';
    import { platformBrowserDynamic } from '@angular/platform-browser-dynamic';
    import { AppModule } from './app/app.module';
    import { environment } from './environments/environment';
    import { enableDebugTools } from '@angular/platform-browser';
    if (environment.production) {
      enableProdMode();
    }
    platformBrowserDynamic().bootstrapModule(AppModule).then(module => {
      let applicationRef = module.injector.get(ApplicationRef);
      let appComponent = applicationRef.components[0];
      enableDebugTools(appComponent);
    })
      .catch(err => console.error(err));
After making this change, you can go ahead and run the following command in your DevTools console:
ng.profiler.timeChangeDetection()
You should see logs similar to the screenshot below:

The time taken for each check for the application above is 0.07 ms. Any healthy application should be anywhere between 3.00 ms. You can also record the current profile by passing in options to the timeChangeDetection method. Run the following command in the console:
ng.profiler.timeChangeDetection({record: true})
You’ll notice that the logs were updated to include start and finish logs:
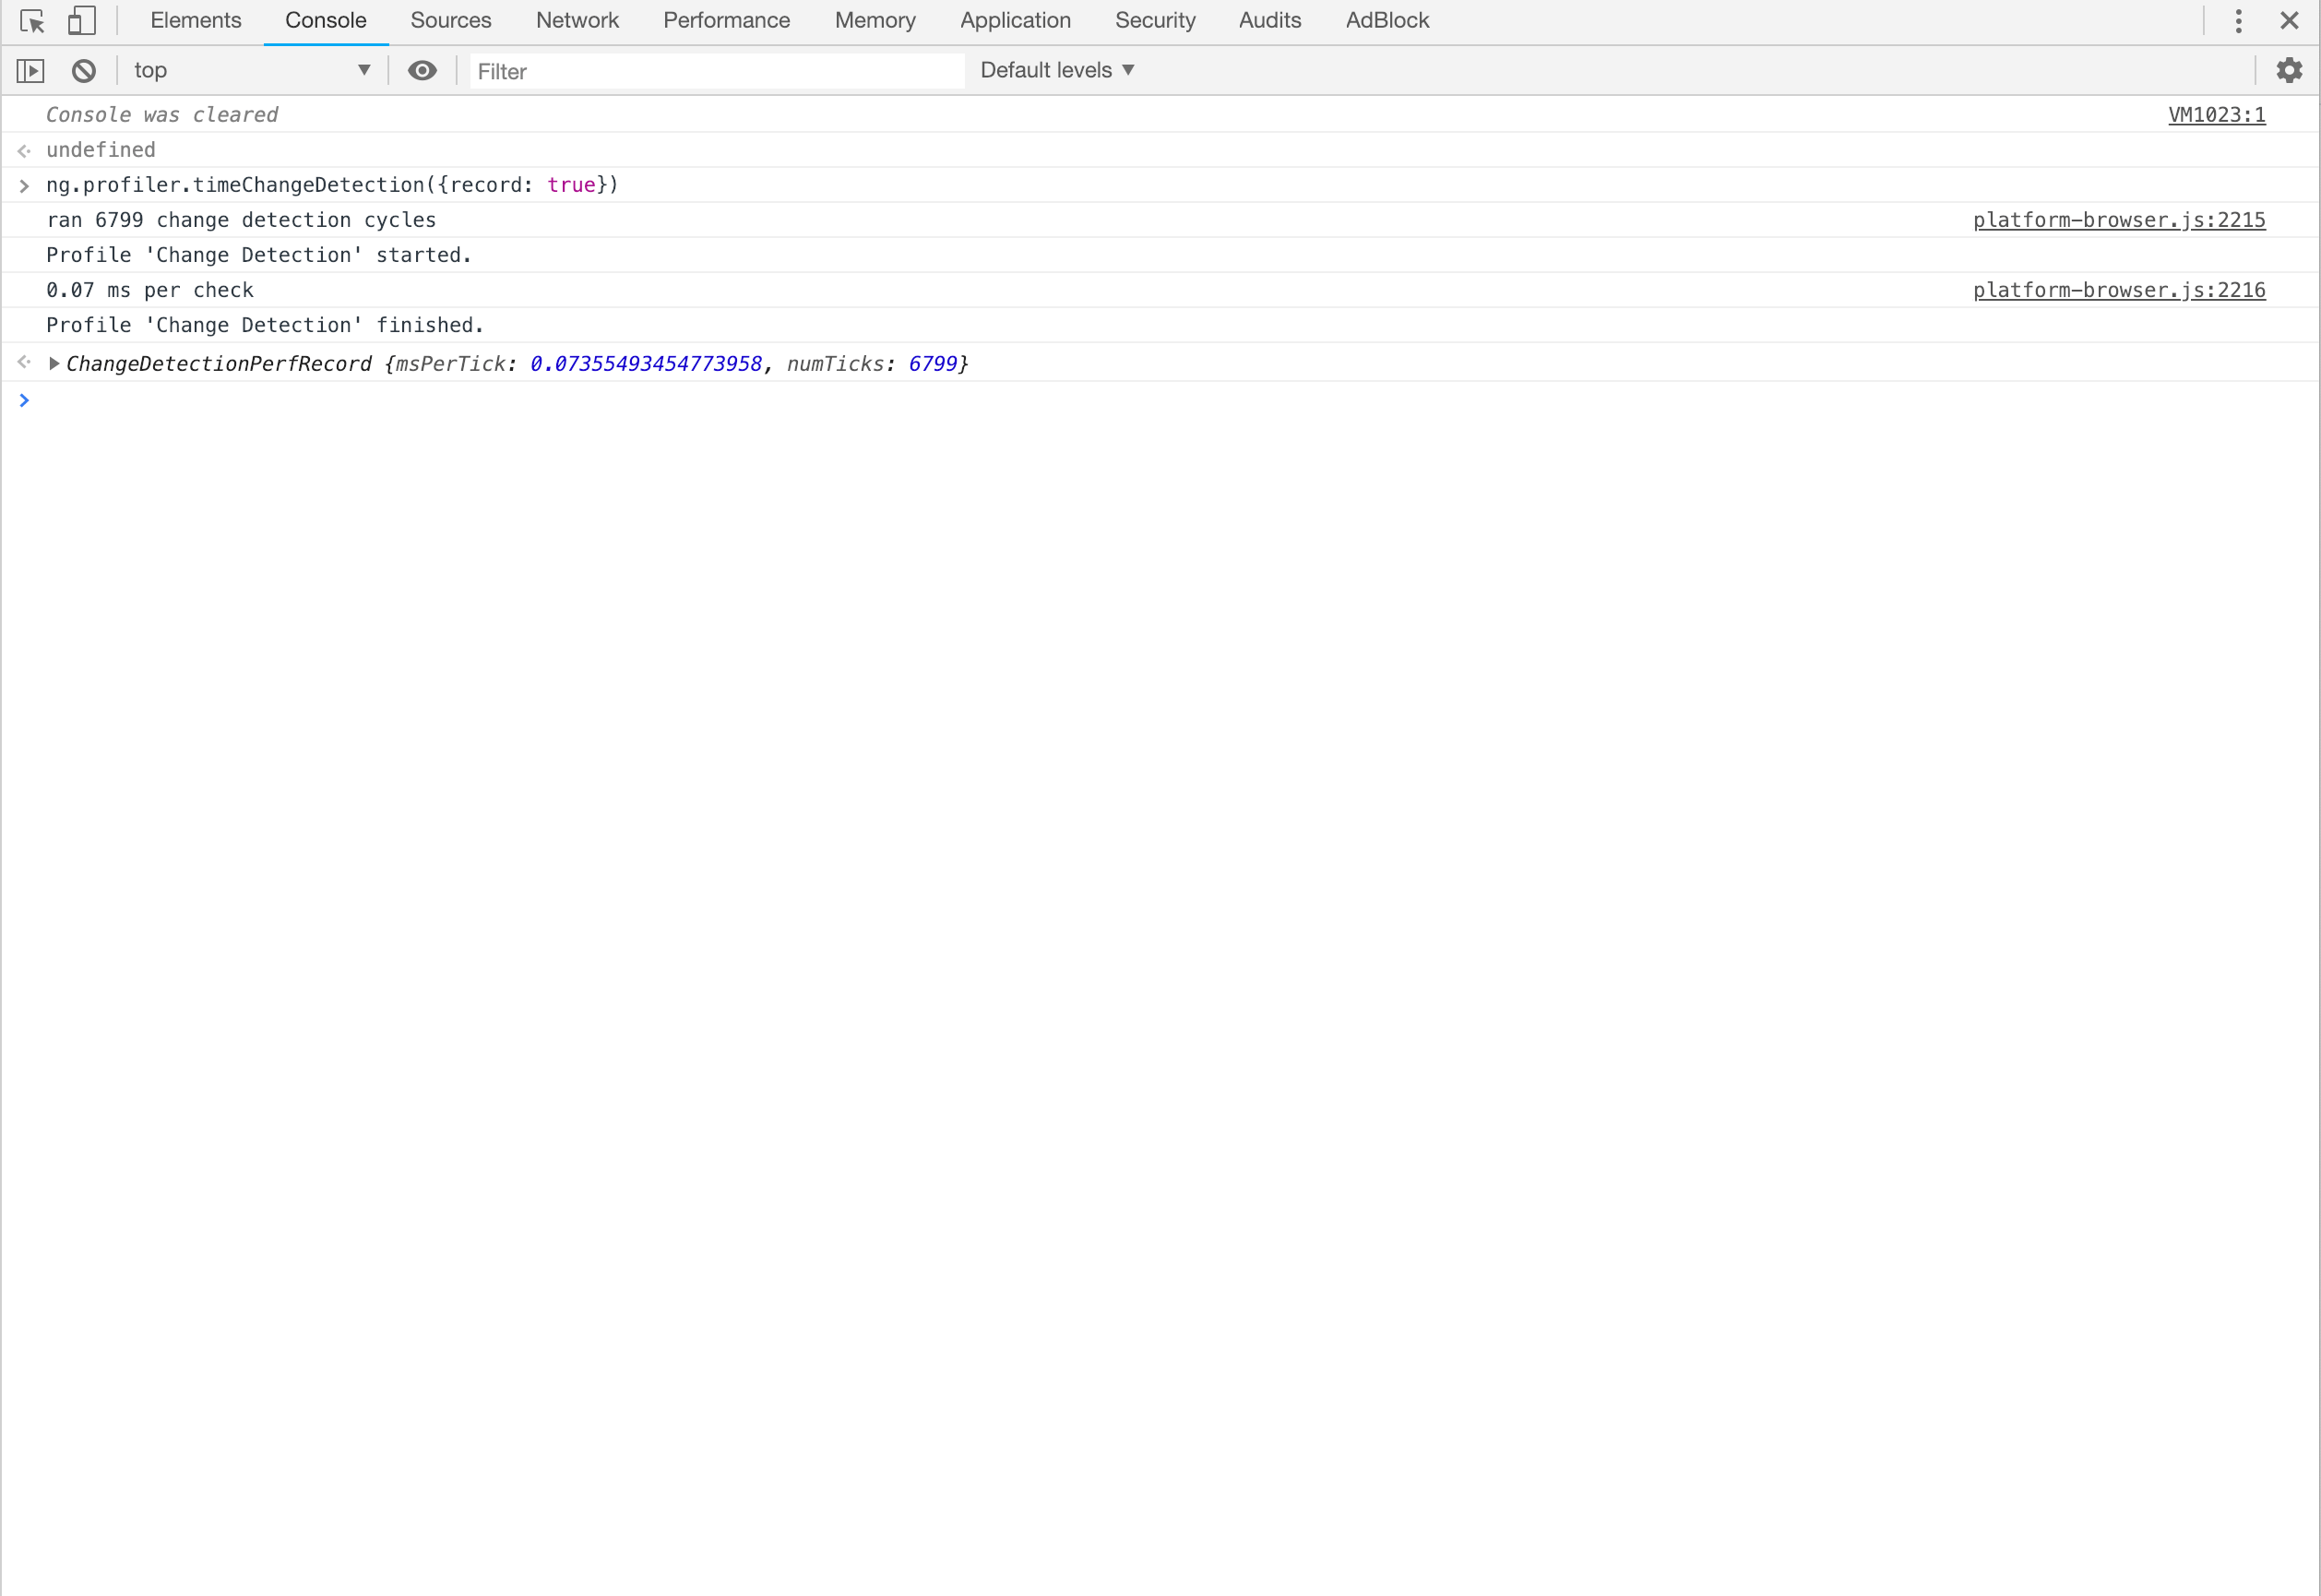
You can then view the recorded profile in the JavaScript Profiler tab within DevTools. It is most likely hidden and can be found when you click the ellipsis icon and hover on more tools. In the profiler tab, you can view precisely the areas where the change detection was run and how long it took.
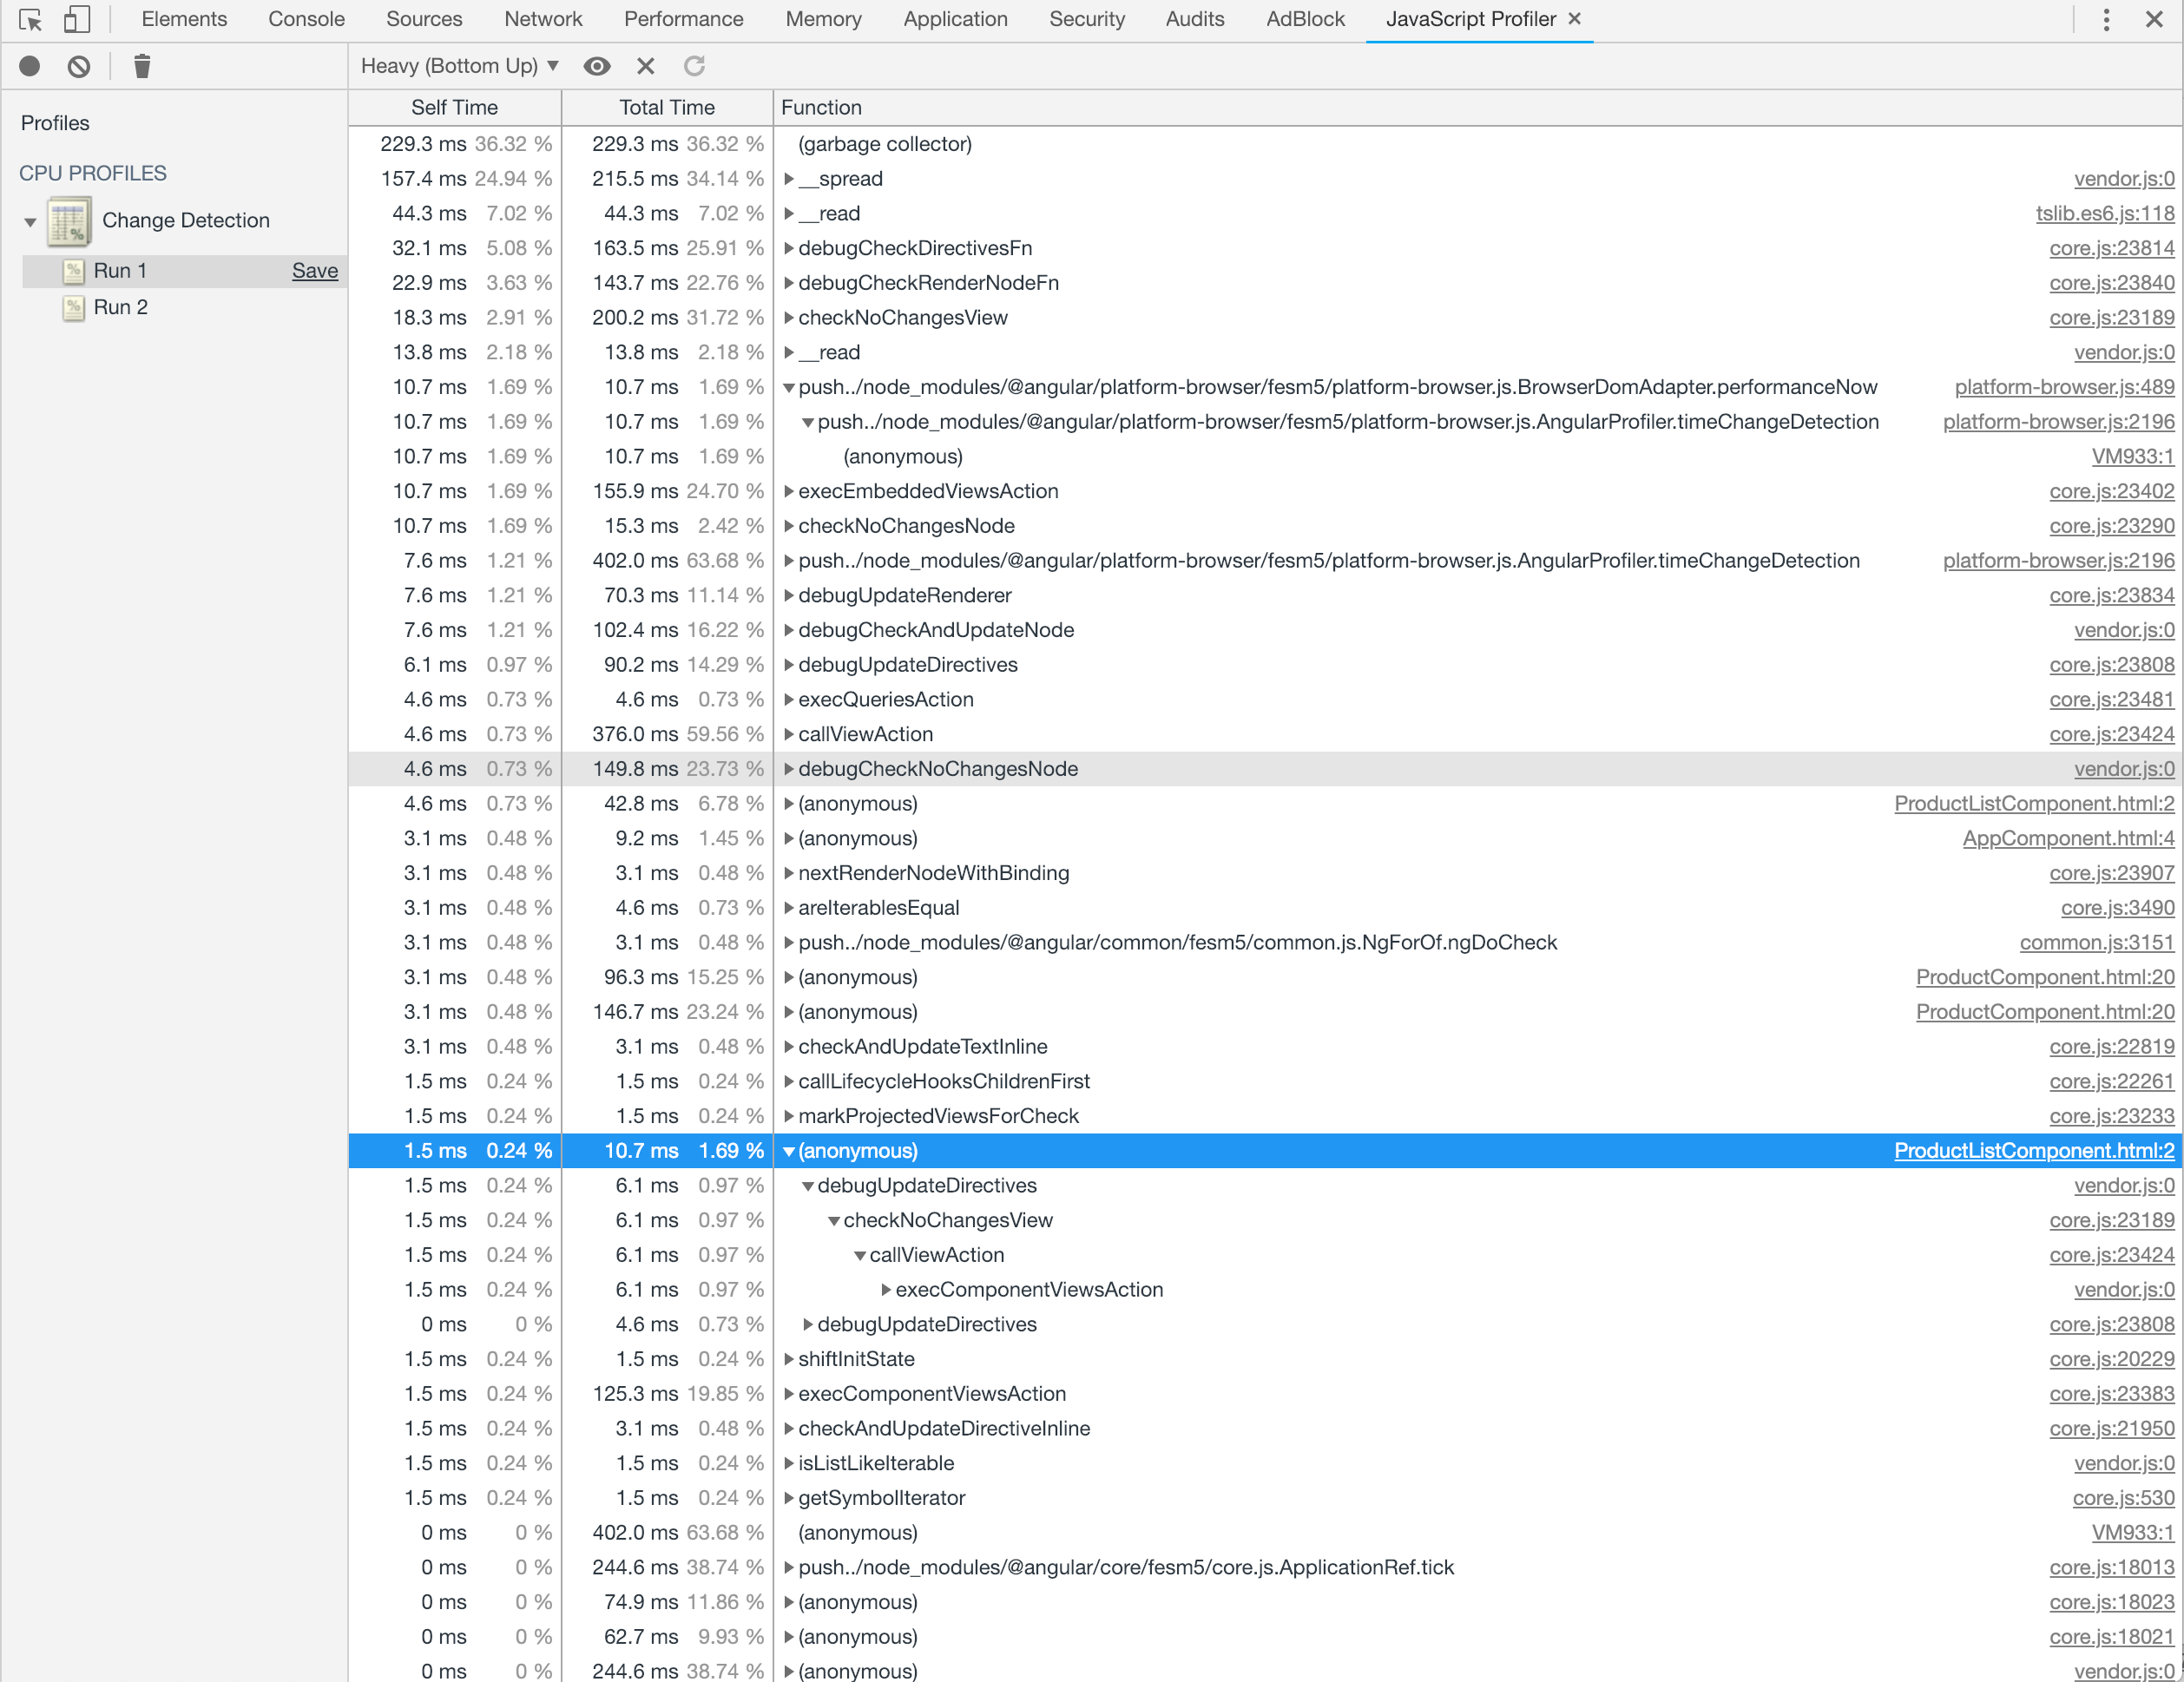
You can also select a chart view in the profiler tab.
Console Debugging
You can’t complete the list without mentioning one of the most effective debugging techniques, logging objects to the console. It is commonly used in development environments to visualize data flowing within the application. There are different methods of posting data to the console, the commonly used ones are console.log, console.warn, and console.error.
You can easily post data to the console when events are triggered by logging the data from the event using any of the console methods:
     addToCart(item: Product) {
        console.log(item);
        this.store.dispatch(new AddToCart(item));
        this.inCart = true;
      }
When an item is added to cart, the item is logged to the console.
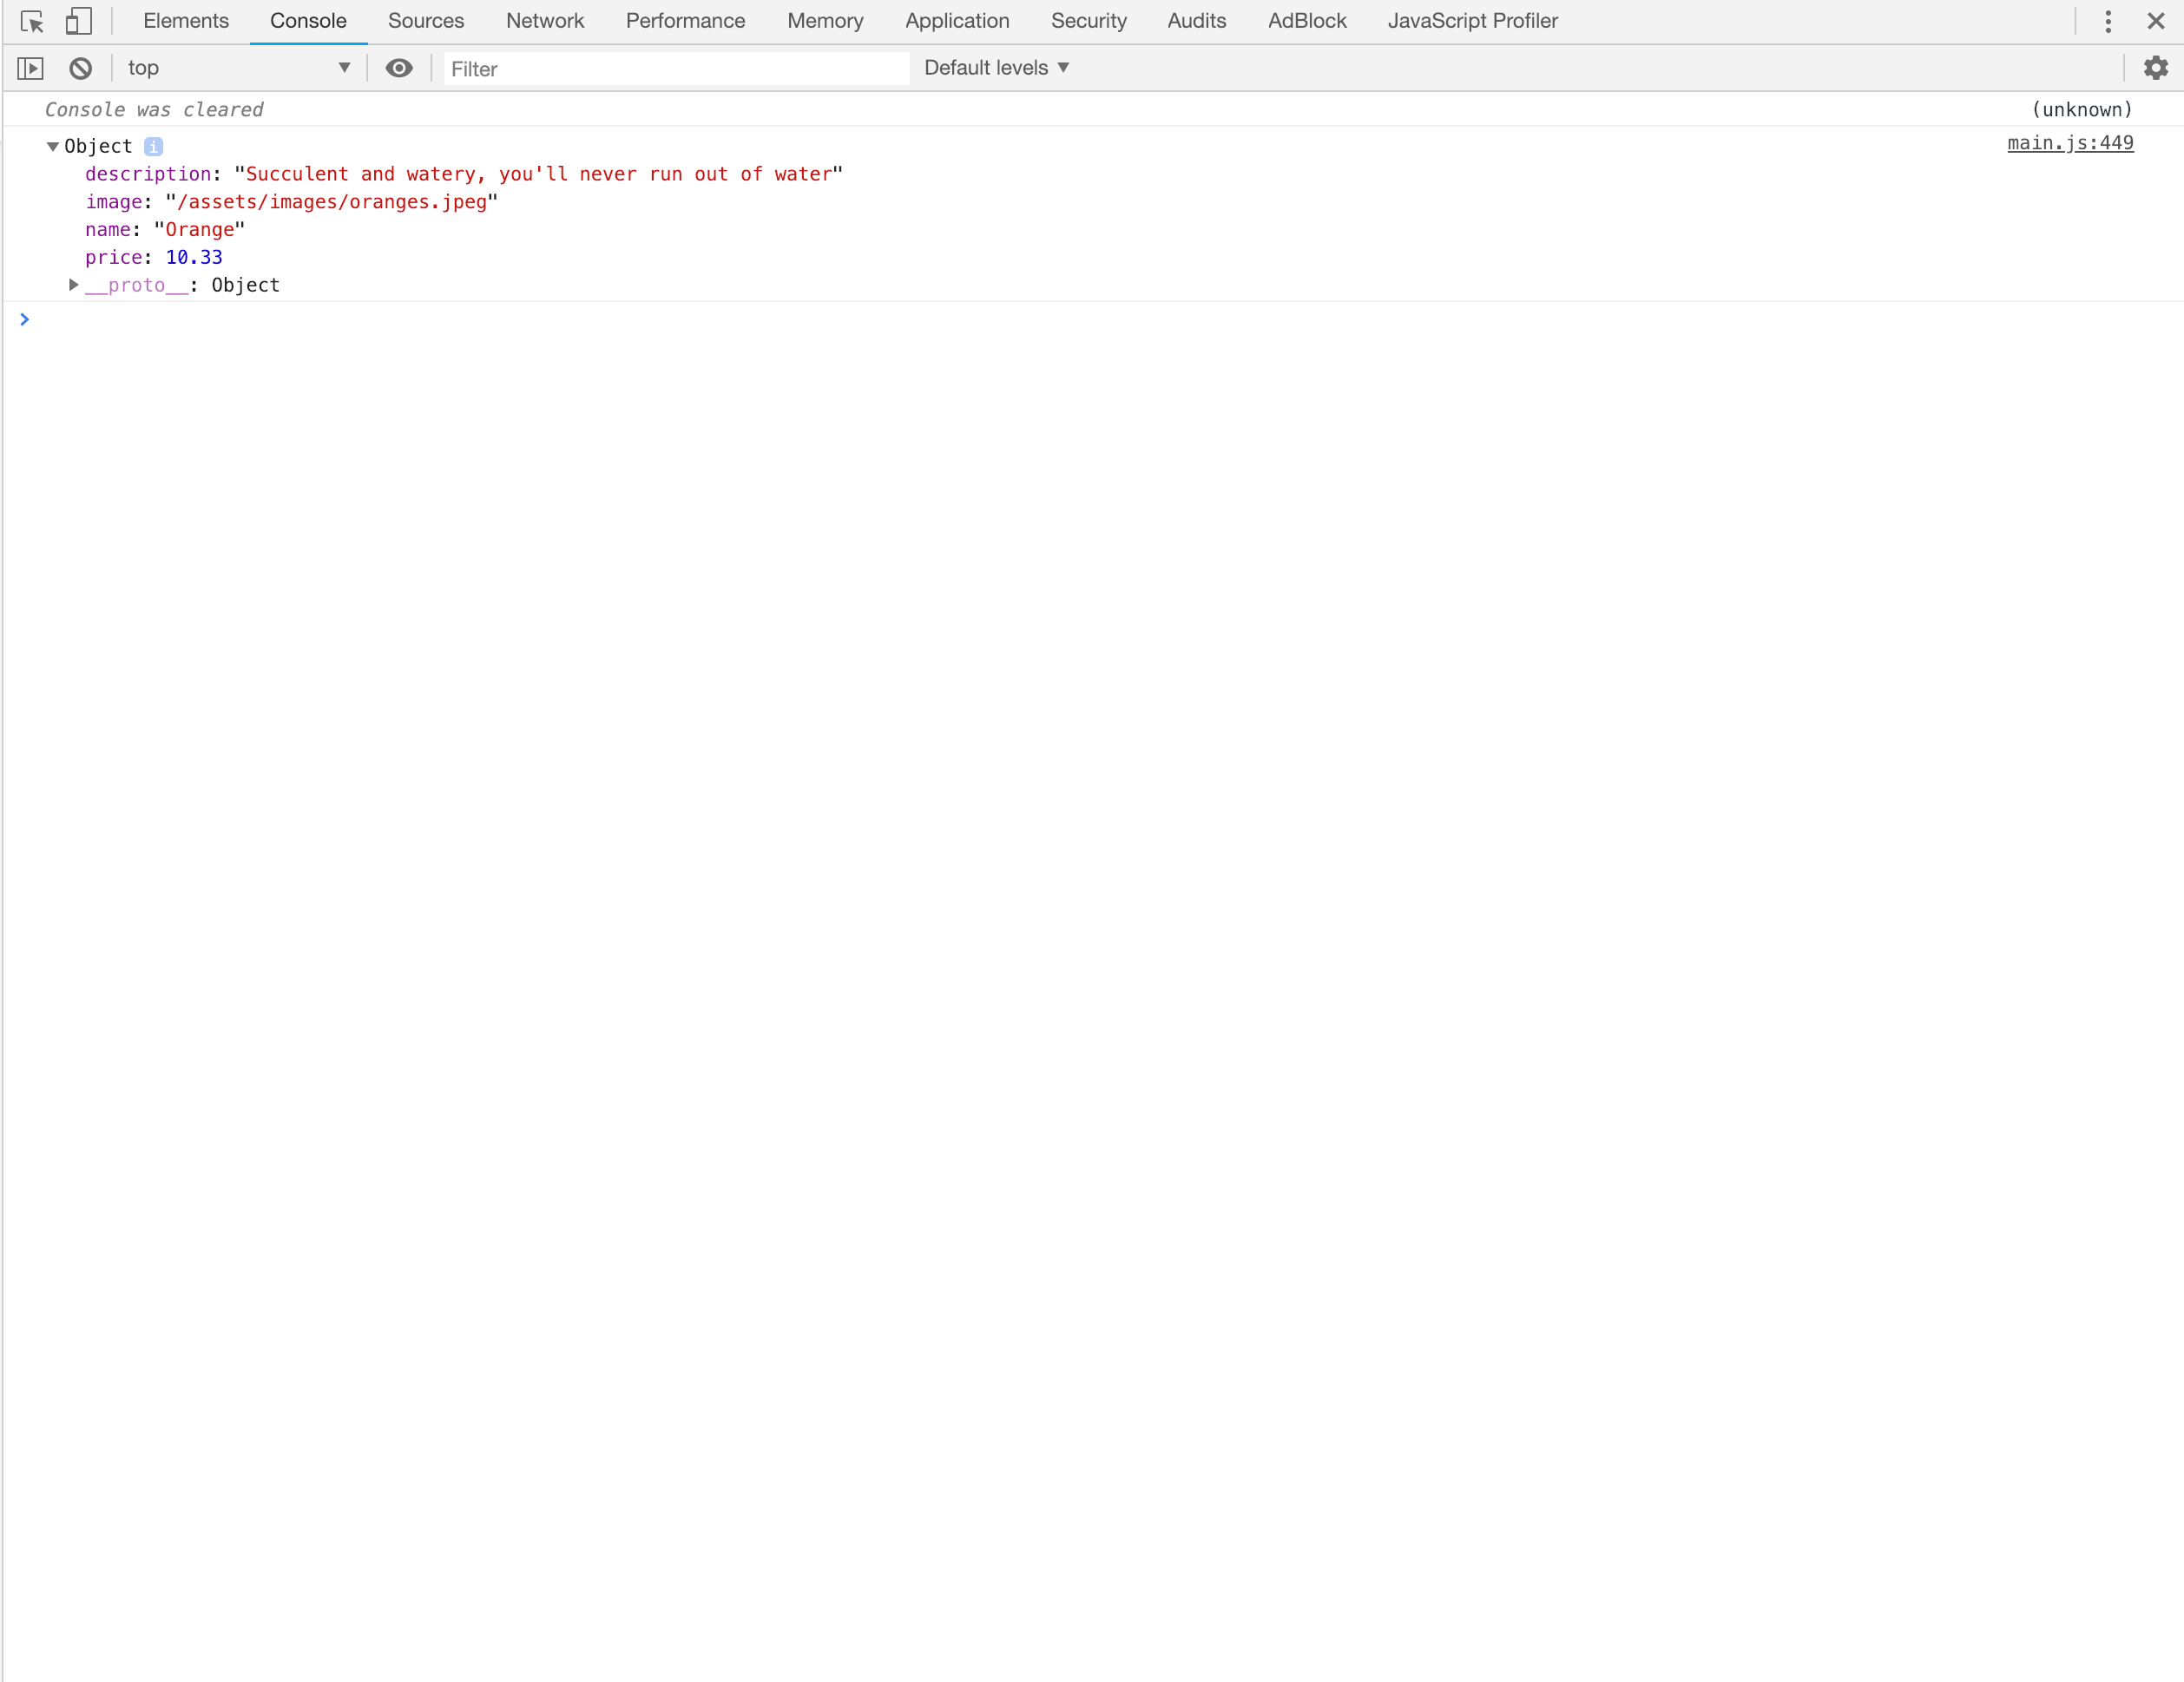
You can post errors from your application to the console too to keep track of them using console.error.
    addToCart(item: Product) {
        try {
          console.log(item);
          this.store.dispatch(new AddToCart(item));
          this.inCart = true;
          throw new Error('an error occurred');
        } catch (e) {
          console.error(e);
        }
      }
When this error occurs, you’ll see the error posted to your console in red text.
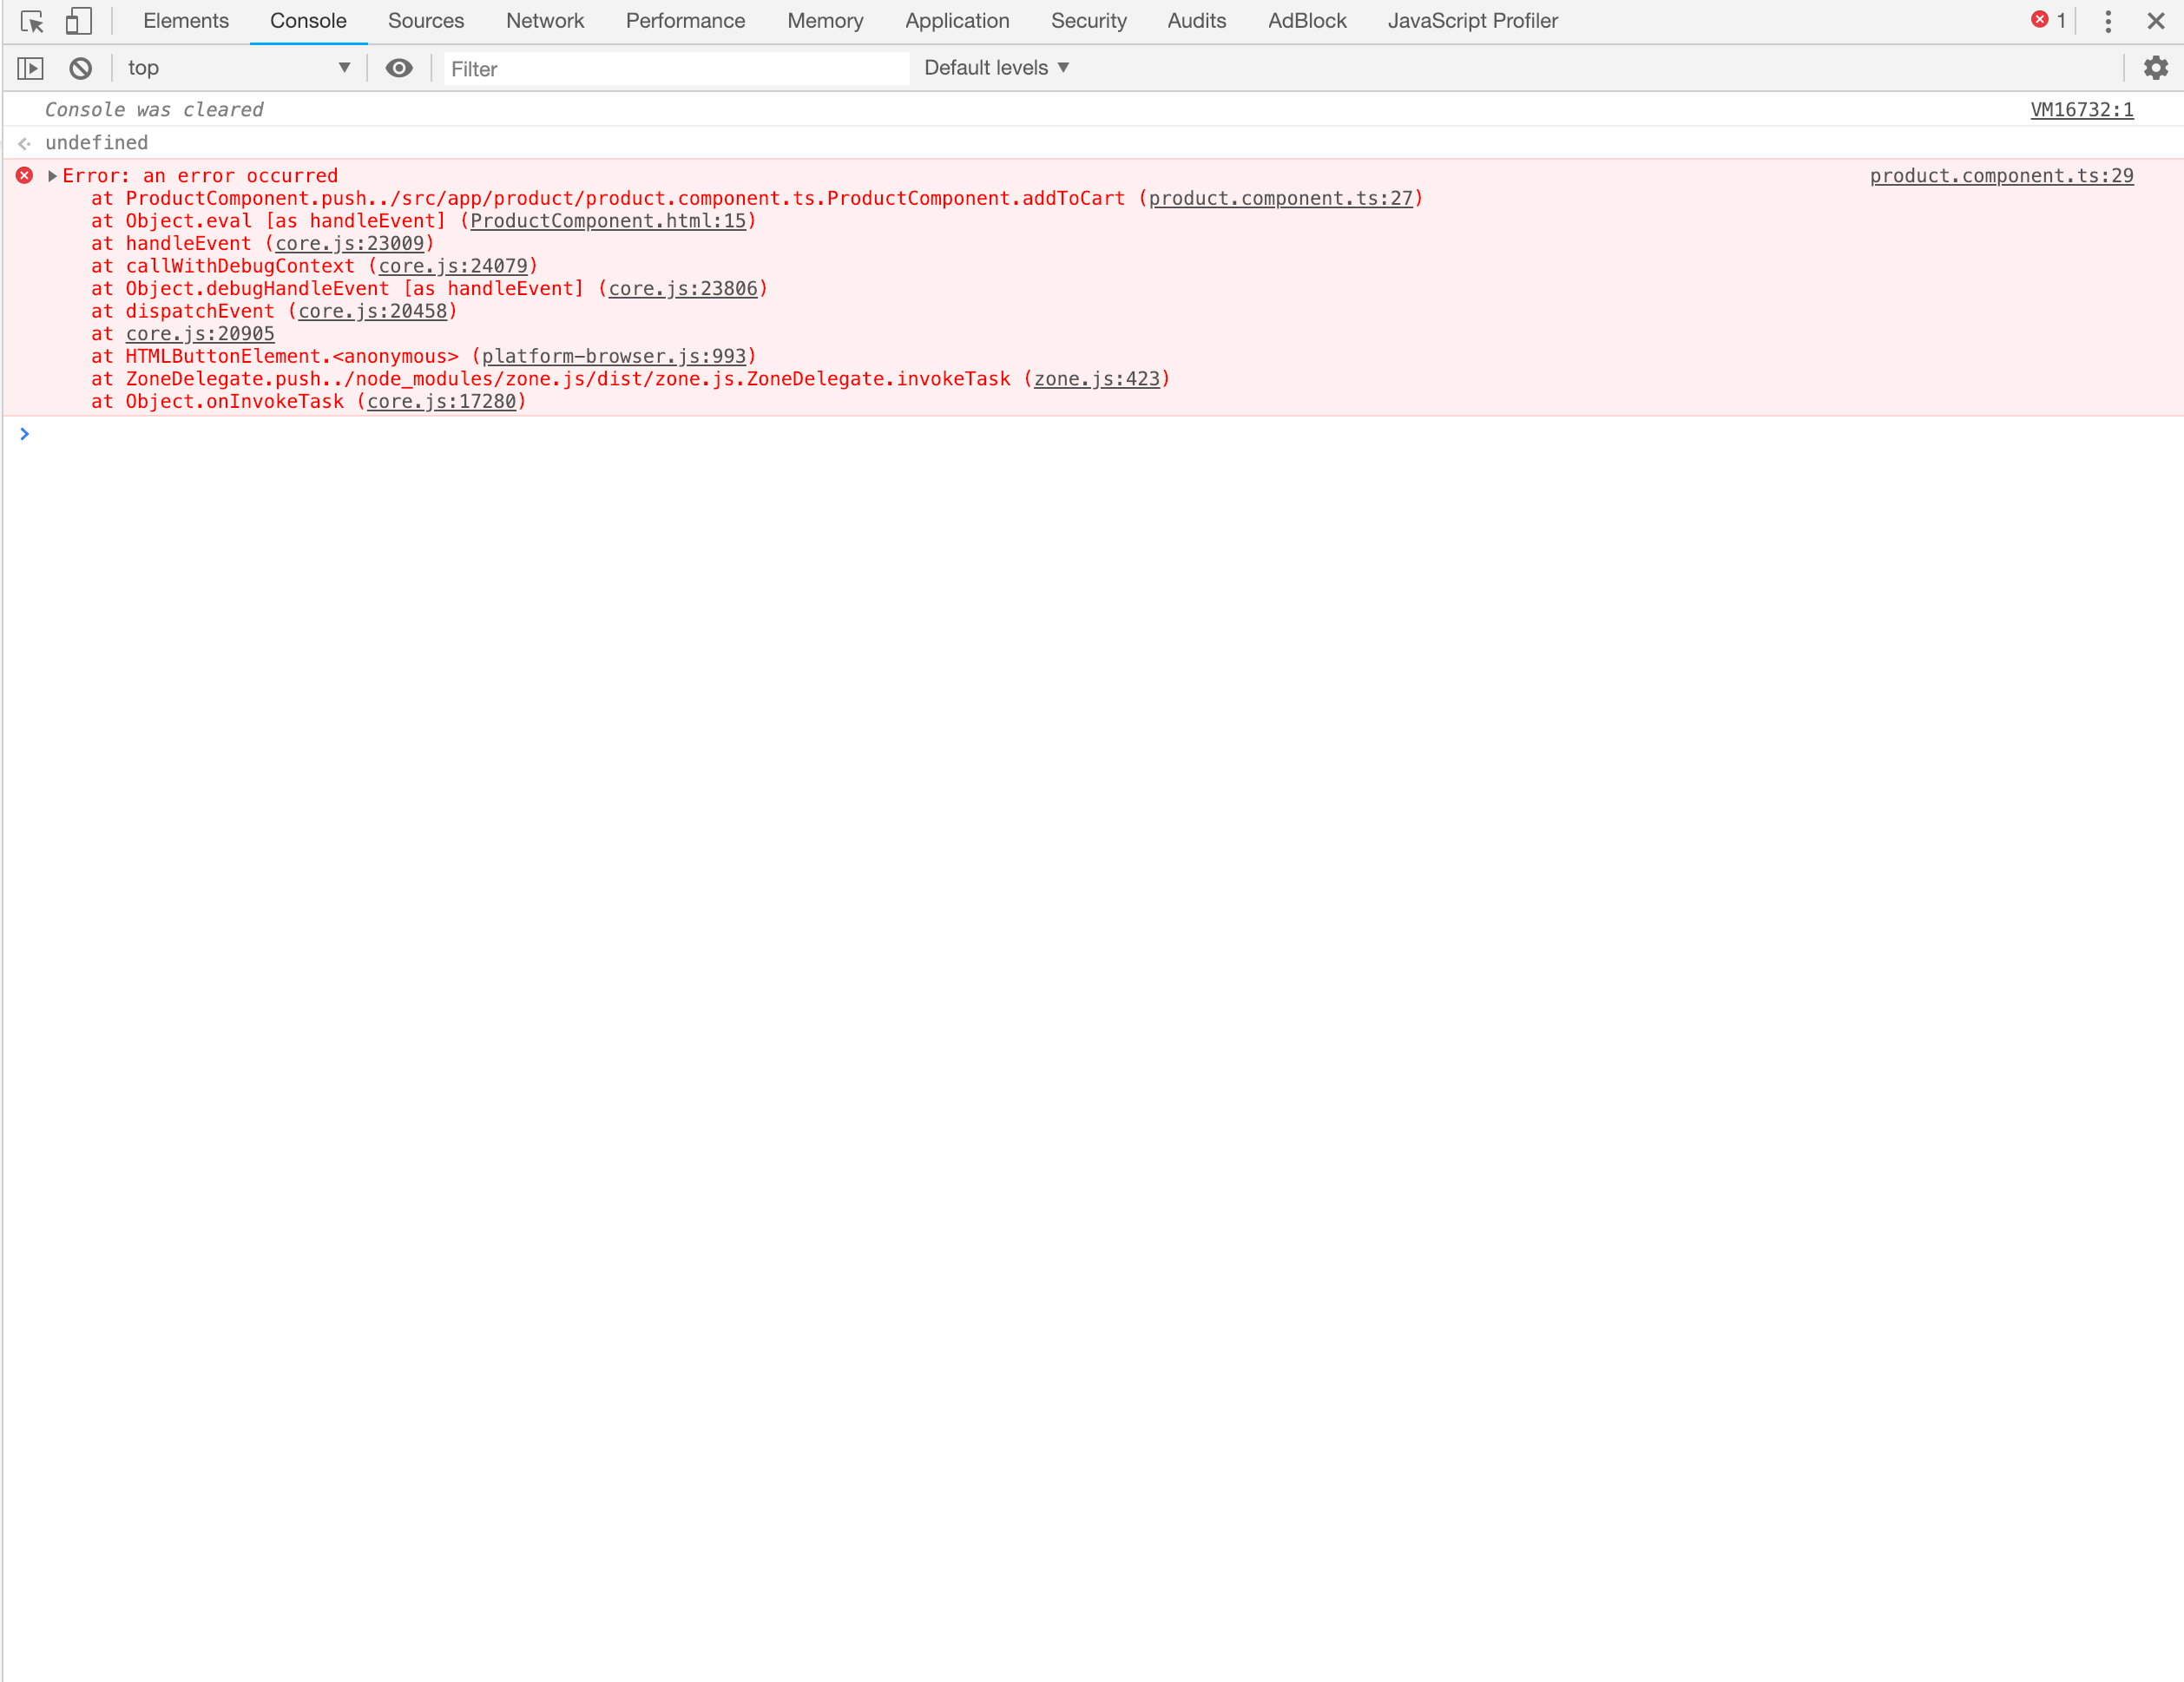
You can also filter console levels to display just errors or logs, etc. It is useful for decluttering the console when searching for data logged to the console using a particular method.
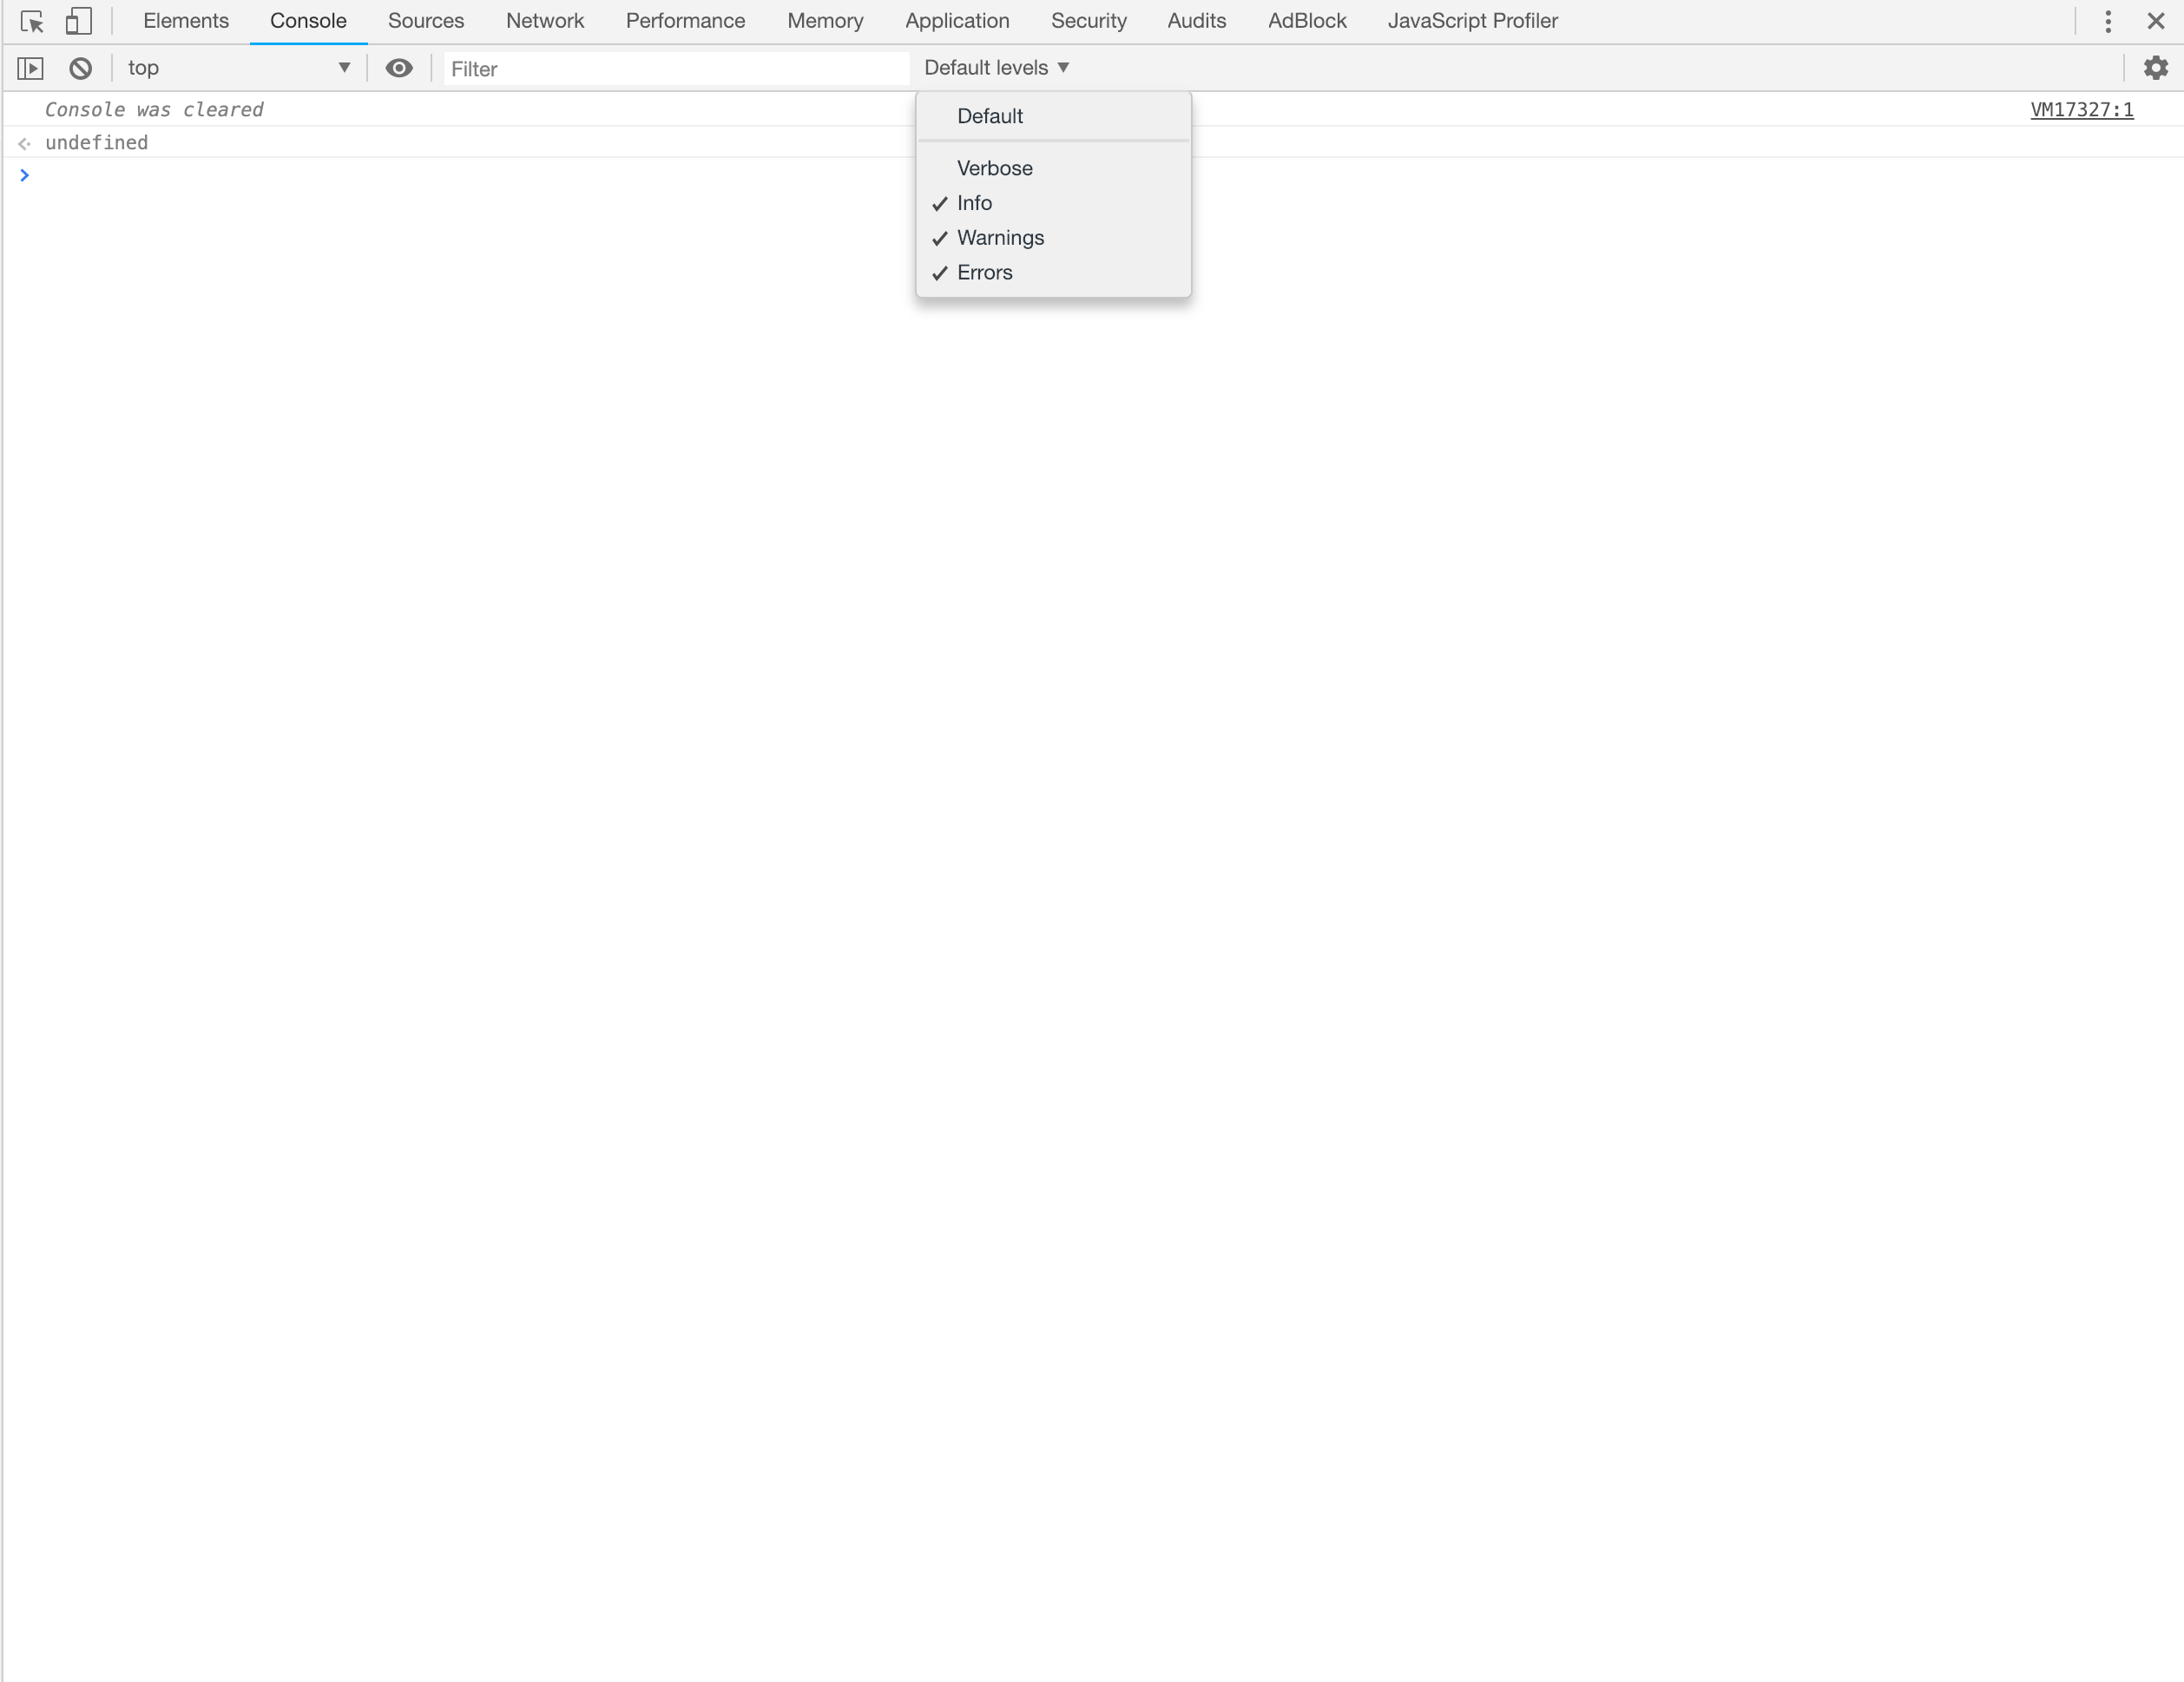
You can read more on the console methods here.
Conclusion
You can’t escape bugs no matter how fast you run or, in this case, how good your codebase is, so picking a debugging technique that works for you is vital. Several debugging techniques and tools can be combined to make debugging an easier task, and any of techniques listed above can be combined to debug effectively. Go get them bugs!!

Christian Nwamba
Chris Nwamba is a Senior Developer Advocate at AWS focusing on AWS Amplify. He is also a teacher with years of experience building products and communities.
