Exploring Fiddler Jam: Get Your Time Back by Solving Issues Faster

With such a busy market to help you diagnose issues with your web app, why Fiddler Jam? In this post, I lay out the case for Fiddler Jam over other free tools.
Your most important resource is time. When non-technical users encounter issues and need your help, how much of this important resource are you spending?
We’ve all been there: a user reports an issue that often doesn’t have the context and details you would like—for example, “the site is slow”—and your support and engineering teams eat up a lot of their time on the back and forth. You might ask the user to send along screenshots of the issue. You might have to get on a call to reproduce the issue—and risk an “it worked differently before” situation. In addition, passing around insecure data can lead to security and compliance issues with your organization.
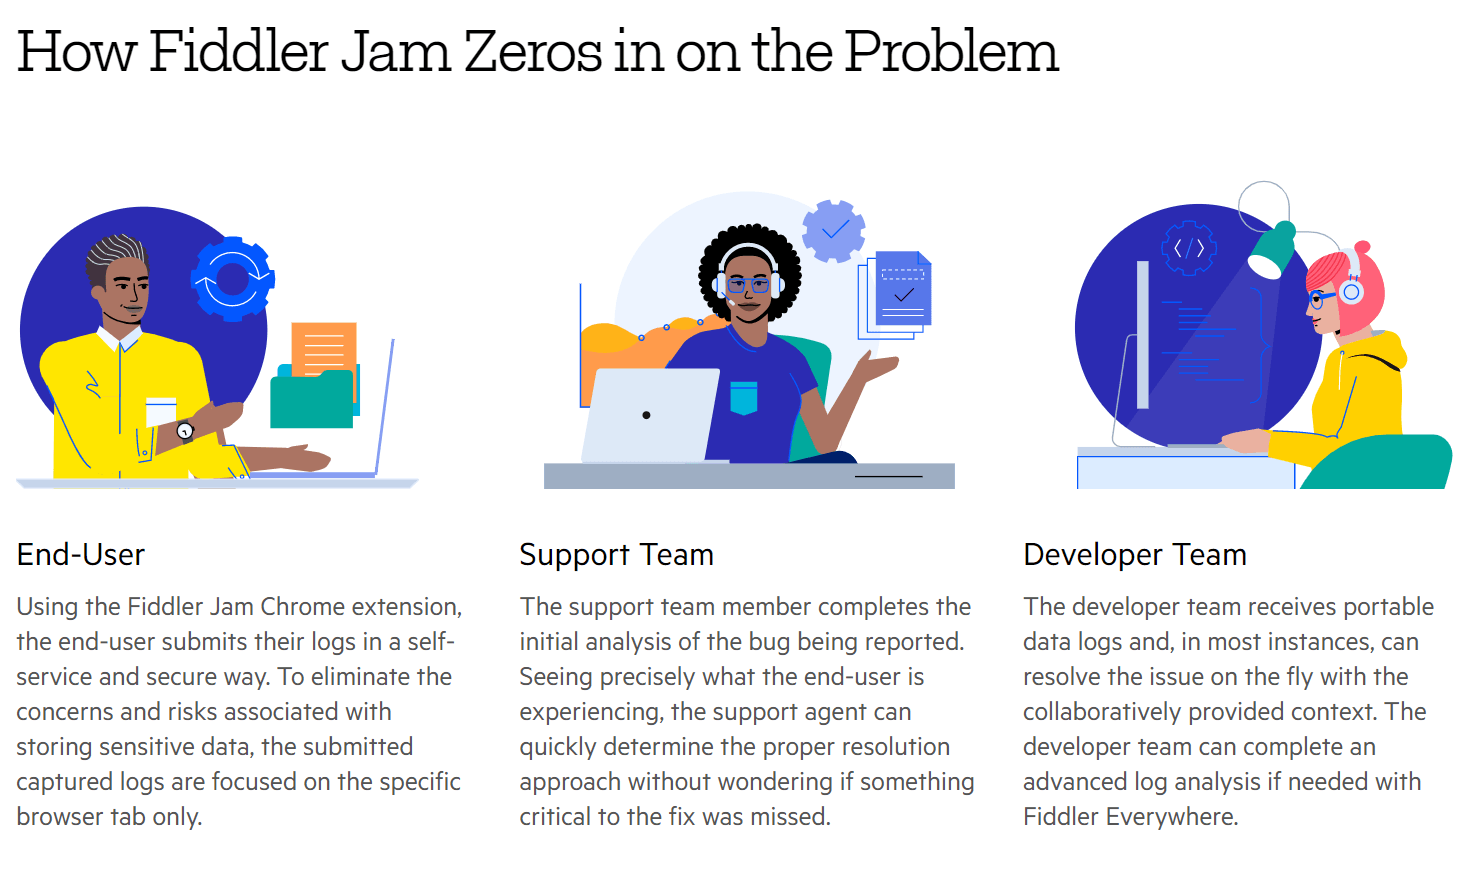
This painful process provides headaches for everyone. End users don’t have an easy way to submit logs securely, support staff wastes a lot of back-and-forth time to reproduce the issue, and engineering teams have trouble understanding the context of the issue and reproducing it successfully.
Have you heard about Fiddler Jam? A relative newcomer to the Telerik Fiddler suite of products, Jam is a solution to help support and development teams troubleshoot remote issues with web applications in a quick, easy and secure fashion. How does it work? Users of your site can use a Chrome extension to share the full context of the issue—capturing network logs, browser console logs and screenshots—and the support team can analyze the data immediately. If needed, developers can reproduce and debug the issue using the Fiddler Everywhere debugging proxy.
When I first learned about Fiddler Jam, I had a question that you might be asking yourself, too: in such a busy market, why should I use Fiddler Jam when I have free tools like a browser’s developer tools? In this post, I’ll make the case for Fiddler Jam in three different ways.
Users Can Easily Send Issue Information
When getting issue details from a user, you’ll lack appropriate context—whether users call you, open a support ticket or email screenshots. You’re now left with putting together a puzzle from what you’re told and what your telemetry tells you. While it’s relatively easy to know when an API service is down, what about a stubborn click event that isn’t logged?
With Fiddler Jam, it’s easy to allow non-technical users to provide context around the issue. In many cases, users can become frustrated to spend so much time reproducing an issue for you when they are already frustrated that things aren’t working. With a couple of button clicks, users can provide the complete context of their interaction with your web app.
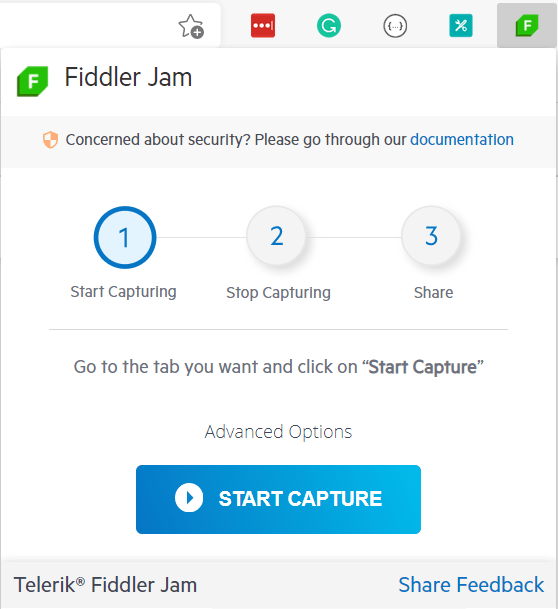
After asking users to download the Fiddler Jam Chrome extension—which you can use with Google Chrome and Microsoft Edge—users will see a Fiddler Jam icon next to the browser’s address bar. Users can then click the icon to start capturing the issue.
Robust Security Practices Are Built In
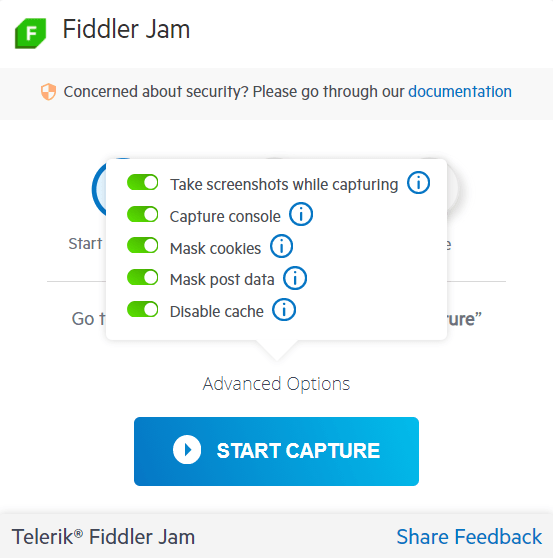
By default, Fiddler Jam also handles the work of sending data securely. If you review the Advanced Options in the Chrome extension, you’ll see a few options you can configure based on your security needs. All options are enabled by default.
-
Take screenshots while capturing – This option adds a screenshot from the active Chrome tab. If the screen shows sensitive data, consider disabling it.
-
Capture console – This option records any developer console outputs. Again, consider disabling this if your logs have sensitive information.
-
Mask cookies – This option masks cookie values so that they aren’t visible in the logs. The cookie names will still be visible.
-
Mask post data – This option masks data sent along in a POST request, like form information.
-
Disable cache – This option asks the browser to skip network requests cache and download fresh content from the server.
After users capture a session, they can share the session using a public link or Password Protection.
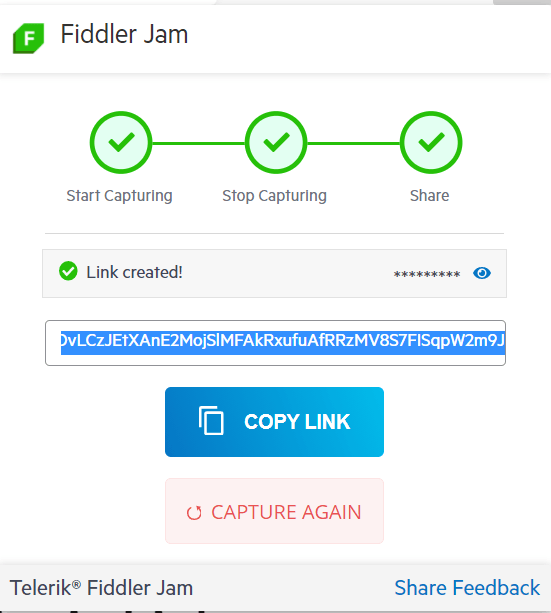
The password-protected logs are secured with AES-CTR encryption, and all logs are stored in the cloud. The Fiddler Jam team won’t have access to (and can’t recover) password-protected log content. See the Fiddler Jam documentation for details.
Use Powerful Tooling to Review the Entire Context Quickly
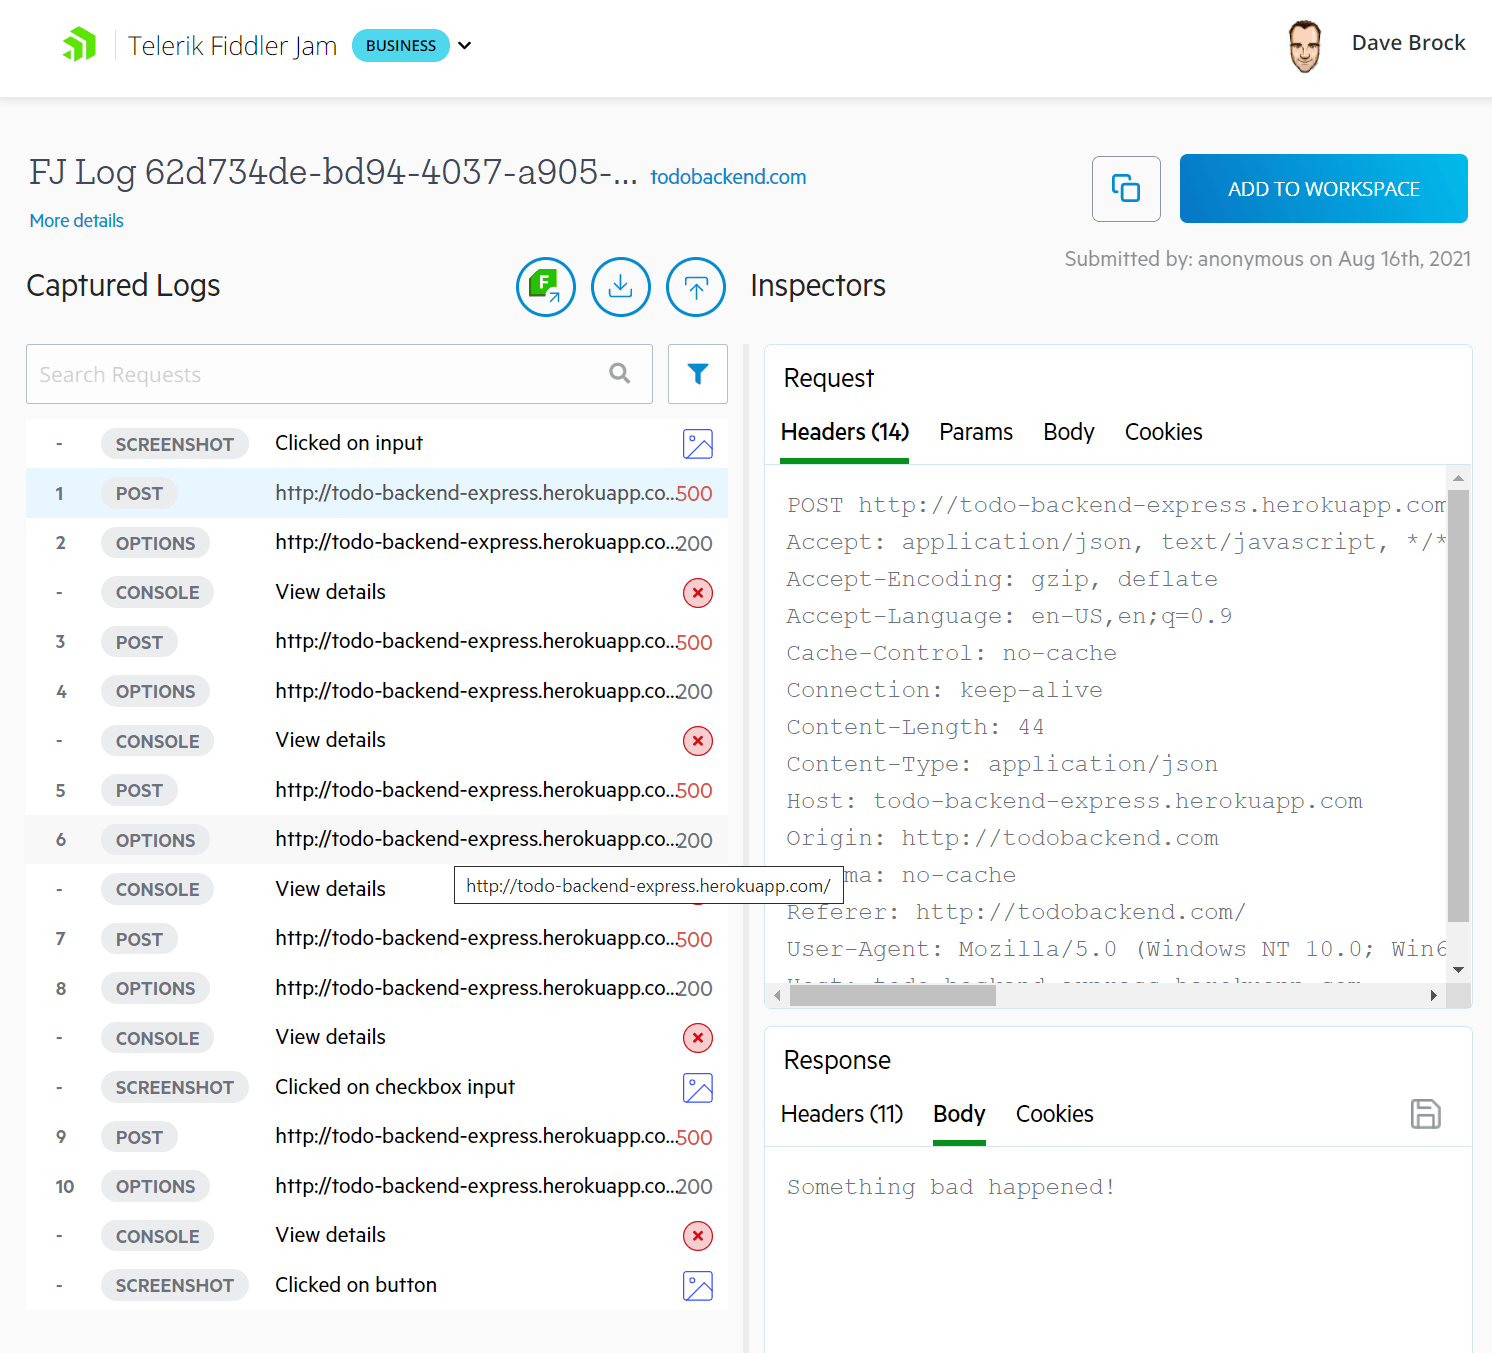
With Fiddler Jam, you can use various tooling options to make the most of the data. When a user shares a link, you’ll be sent to the Telerik Fiddler Jam dashboard for a detailed view of the logs and information on the request—like headers and request/response bodies. Here’s how it looks when I’m reviewing a server error, where I have Something bad happened as a response. (I suppose it is an accurate statement but could use more investigation.)
By default, I can also look at user actions. I can look at the button press that initiated the call to the server.
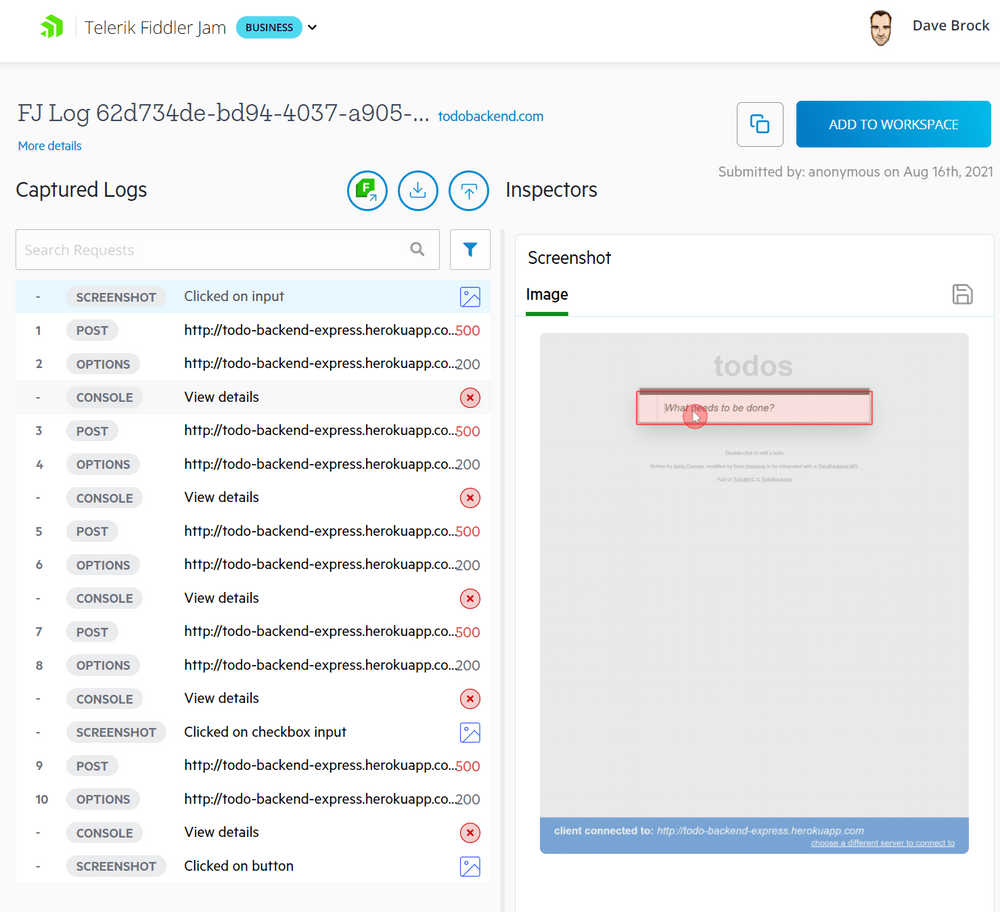
In future versions, Fiddler Jam will capture more user actions like inputs and scroll events. These actions are stored in the cloud at no additional cost to you. It’s one of my favorite features. There’s no guessing of what a user said they did and what really happened. It’s all here.
The data comes in the format of an HTTP Archive (HAR) file, which is an industry-standard JSON-formatted file that saves HTTP performance data. You can download the HAR file for further inspection and even load the HAR file for mocking. To be clear, this is not the mocking my team does to me when I introduce a bug to the codebase. Instead, Jam sends the data to the Chrome extension, where you can load a session in the browser.
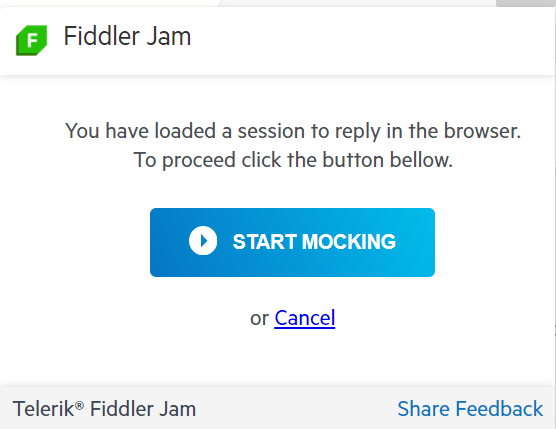
Finally, the engineering team can open the session in Fiddler Everywhere for further investigation. With Fiddler Everywhere’s powerful capabilities, you can even replay requests from a user’s session!
Summary
In this post, I’ve shown you how Fiddler Jam provides robust capabilities to help you reproduce and resolve issues quickly. More than just another set of developer tools, it’s a full end-to-end troubleshooting solution designed to work well for users, support and engineering alike. Get started with Fiddler Jam today by going to the Fiddler Jam site and signing up for a free 14-day trial.

Dave Brock
Dave Brock is a software engineer, writer, speaker, open-source contributor and Microsoft MVP. With a focus on Microsoft technologies, Dave enjoys advocating for modern and sustainable cloud-based solutions. He writes regularly at daveabrock.com. To reach Dave, follow him on Twitter, where his dad jokes are a parent.
