# Bullet Charts
The Telerik UI Bullet HtmlHelper for ASP.NET MVC is a server-side wrapper for the Kendo UI Bullet widget.
Bullet Charts represent a variation of the [Bar Chart](https://www.telerik.com/aspnet-mvc/documentation/html-helpers/charts/chart-types/bar-charts).
* [Demo page for the Bullet Chart](https://demos.telerik.com/aspnet-mvc/bullet-charts/index)
## Getting Started
You can use the Bullet Chart component to visualize a comparison between an expected (target) and actual (current) value—for example, company profit, employee performance, weather data, and so on.
To create a Bullet series in the Chart component, use `Bullet` and `VerticalBullet` in the `Series` configuration.
* [Configuring the axes](https://www.telerik.com/aspnet-mvc/documentation/html-helpers/charts/chart-types/bullet-charts#configuring-the-axes)
* [Customizing the target value lines](https://www.telerik.com/aspnet-mvc/documentation/html-helpers/charts/chart-types/bullet-charts#customizing-the-target-value-lines)
## Configuring the Axes
To configure the axes, use the `CategoryAxis` and `ValueAxis` settings. Multiple value axes are also supported.
```Razor HtmlHelper
@(Html.Kendo().Chart()
.Name("chart")
.Legend(legend => legend
.Visible(false)
)
.Series(series => {
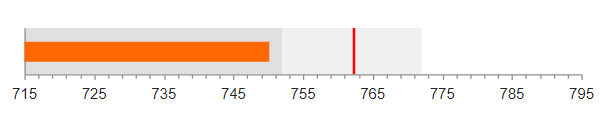
series.Bullet(new double[][] { new double[] { 750, 762.5 }});
})
.ChartArea(chartArea => chartArea.Margin(0))
.CategoryAxis(axis => axis
.MajorGridLines(lines => lines.Visible(false))
.MajorTicks(lines => lines.Visible(false))
)
.ValueAxis(axis => axis
.Numeric()
.Min(715)
.Max(795)
.MinorTicks(lines => lines.Visible(true))
.MajorGridLines(lines => lines.Visible(false))
.PlotBands(bands => {
bands.Add().From(715).To(752).Color("#ccc").Opacity(0.6);
bands.Add().From(752).To(772).Color("#ccc").Opacity(0.3);
})
)
.Tooltip(tooltip => tooltip
.Visible(true)
.Shared(true)
.Template("Maximum: #= value.target #
Average: #= value.current #")
)
)
```
The configuration from the previous example results in the following Bullet Chart.
## Customizing the Target Value Lines
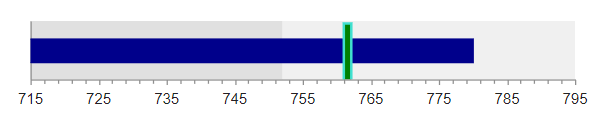
You can customize the line that represents the target value through the `Target` series configuration. `Target` exposes the `Border`, `Color`, and `Line` main settings that control the line appearance.
The following example demonstrates how to use all three options to customize the target line.
```Razor HtmlHelper
.Series(series =>
{
series
.Bullet(new double[][] { new double[] { 780, 762.5 } })
.Color("darkblue")
.Target(target=>target
.Color("green")
.Border(b=>b
.Color("turquoise")
.Width(2)
)
.Line(l=>l.Width(6))
);
})
```
## See Also
* [Basic Usage of the Bullet Chart for ASP.NET MVC (Demo)](https://demos.telerik.com/aspnet-mvc/bullet-charts/index)
* [Server-Side API](https://www.telerik.com/aspnet-mvc/documentation/api/chart)