# Bar Charts
The Telerik UI Bar Chart HtmlHelper for ASP.NET MVC is a server-side wrapper for the Kendo UI Bar Chart widget.
Bar Charts display data through horizontal or vertical bars whose lengths vary according to their value.
* [Demo page for the Bar Chart HtmlHelper](https://demos.telerik.com/aspnet-mvc/area-charts/index)
## Getting Started
Bar Charts are suitable for displaying a comparison between sets of data—for example, a summary of unique and total site visitors over a certain period of time.
The [Telerik UI Bullet Chart component for ASP.NET MVC](https://demos.telerik.com/aspnet-mvc/bullet-charts/index) is a variation of a Telerik UI Bar Chart. You can use it as a replacement for dashboard gauges and meters. The bullet graph compares a given quantitative measure, such as temperature, against qualitative ranges, such as warm, hot, mild, cool, chilly, cold, and so on, and a symbol marker that encodes the comparative measure, such as the max temperature a year ago.
The [Telerik UI Range Bar Chart component for ASP.NET MVC](https://demos.telerik.com/aspnet-mvc/range-bar-charts/index) is yet another variation of the Telerik UI Bar Chart. It displays data as bars where each bar represents a value range that spans between its minimum and maximum levels. A Range Bar type has floating bars unlike the standard Telerik UI Bar Chart that has bars that are anchored to its `x`-axis.
To create a Bar series in the Chart component, use `Column` or `Bar` in the `Series` configuration.
* [Defining a Column Chart](https://www.telerik.com/aspnet-mvc/documentation/html-helpers/charts/chart-types/bar-charts#defining-the-column-chart)
* [Defining a Bar Chart](https://www.telerik.com/aspnet-mvc/documentation/html-helpers/charts/chart-types/bar-charts#defining-the-bar-chart)
## Defining the Column Chart
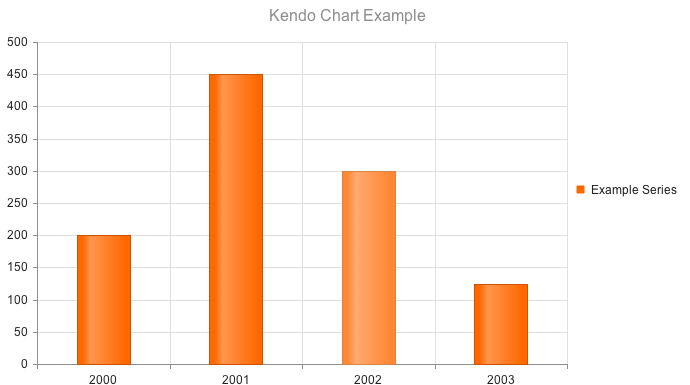
The [Telerik UI Column Chart for ASP.NET MVC](https://demos.telerik.com/aspnet-mvc/bar-charts/column) is rendered when the `Series` is `Column`.
```Razor HtmlHelper
@(Html.Kendo().Chart()
.Name("chart")
.Title("Kendo Chart Example")
.Legend(legend => legend
.Position(ChartLegendPosition.Bottom)
)
.Series(series =>
{
series.Column(new double[] { 200, 450, 300, 125 }).Name("Example Series");
})
.CategoryAxis(axis => axis
.Categories(new string[] { "2000", "2001", "2002", "2003" })
)
)
```
## Defining the Bar Chart
Setting the `Series` object to `"Bar"` renders horizontal bars.
```Razor HtmlHelper
@(Html.Kendo().Chart()
.Name("chart")
.Title("Kendo Chart Example")
.Legend(legend => legend
.Position(ChartLegendPosition.Bottom)
)
.Series(series =>
{
series.Bar(new double[] { 200, 450, 300, 125 }).Name("Example Series");
})
.CategoryAxis(axis => axis
.Categories(new string[] { "2000", "2001", "2002", "2003" })
)
)
```

## See Also
* [Basic Usage of the Bar Chart HtmlHelper for ASP.NET MVC (Demo)](https://demos.telerik.com/aspnet-mvc/bar-charts/index)
* [Basic Usage of the Range Bar Chart HtmlHelper for ASP.NET MVC (Demo)](https://demos.telerik.com/aspnet-mvc/range-bar-charts/index)
* [Server-Side API](https://www.telerik.com/aspnet-mvc/documentation/api/chart)