# Getting Started with the Chart Wizard
This tutorial explains how to set up the Telerik UI for ASP.NET Core Chart Wizard and goes through the steps in the configuration of the component.
The Chart Wizard component provides a user-friendly interface that allows you to create and customize various chart visualizations using data from external sources or from a [Grid](https://www.telerik.com/aspnet-core-ui/documentation/html-helpers/data-management/grid/overview).
You will initialize a Chart Wizard component and bind it to a remote service. Then, you will configure different export and window options for the component. Finally, you can run the sample code in [Telerik REPL](https://netcorerepl.telerik.com/) and continue exploring the components.
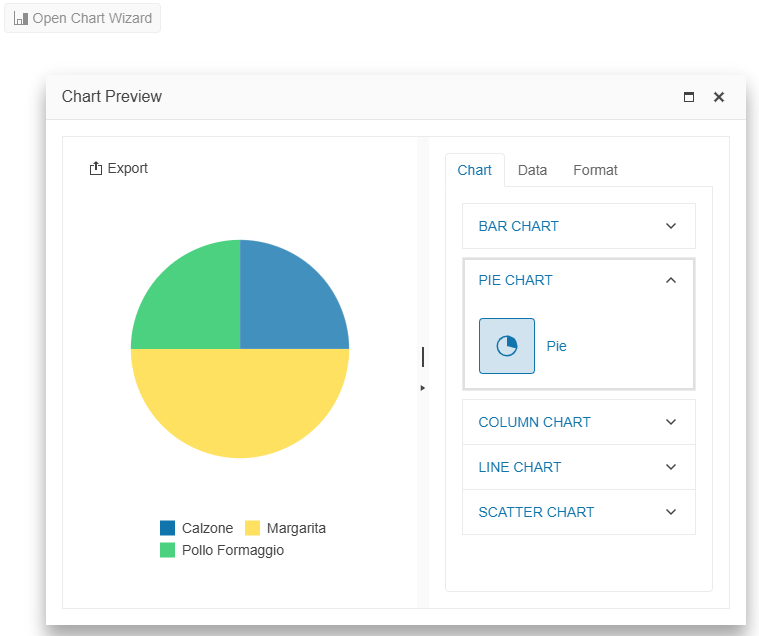
After completing this guide, you will achieve the following results:
## Prerequisites
To successfully complete the tutorial, you need a project that is already configured to use the Telerik UI for ASP.NET Core components:
* To create a new pre-configured project for the Telerik UI for ASP.NET Core components, you can use [a project template](https://www.telerik.com/aspnet-core-ui/documentation/vs-integration/new-project-wizard).
## 1. Prepare the CSHTML File
The first step is to add the required directives at the top of the `.cshtml` document:
* To use the Telerik UI for ASP.NET Core HtmlHelpers:
```cshtml
@using Kendo.Mvc.UI
```
* To use the Telerik UI for ASP.NET Core TagHelpers:
```cshtml
@addTagHelper *, Kendo.Mvc
```
Optionally, you can structure the document by adding the desired HTML elements like headings, divs, paragraphs, and others.
```Razor HtmlHelper
@using Kendo.Mvc.UI
Generate charts using the Chart Wizard
```
```Razor TagHelper
@addTagHelper *, Kendo.Mvc
Generate charts using the Chart Wizard
```
## 2. Initialize the Chart Wizard
Use the Chart Wizard HtmlHelper or TagHelper to configure the component.
* The `Name()` configuration method is mandatory as its value is used for the `id` and the `name` attributes of the Chart Wizard element.
* The `DataColumns()` option specifies the Model properties that will be available in the chart configurator to set up the chart series and axes.
* The `DataSource()` configuration connects the component to a dataset retrieved from a remote endpoint.
```Razor HtmlHelper
@(Html.Kendo().ChartWizard()
.Name("chartwizard")
.DataSource(dataSource => dataSource
.Read(read => read.Action("Read", "Home"))
)
.DataColumns(columns =>
{
columns.Add().Field(f => f.ProductName).Title("Product Name");
columns.Add().Field(f => f.Quantity);
})
)
```
```Razor TagHelper
@addTagHelper *, Kendo.Mvcl
```
## 3. Bind the Chart Wizard Component to Its Data
Create a `Product` Model and define an Action method that returns the data collection.
```C# Model
public class Product
{
public int ProductID { get; set; }
public string ProductName { get; set; }
public int Quantity { get; set; }
}
```
```C# HomeController.cs
public JsonResult Read([DataSourceRequest] DataSourceRequest request)
{
return Json(ProductsData().ToDataSourceResult(request));
}
private static List ProductsData()
{
return new List()
{
new Product { ProductID = 216321, ProductName = "Calzone", Quantity = 1 },
new Product { ProductID = 546897, ProductName = "Margarita", Quantity = 2 },
new Product { ProductID = 456231, ProductName = "Pollo Formaggio", Quantity = 1 }
};
}
```
## 4. Configure the Export Options
The Chart Wizard component allows you to export the generated chart in `PDF`, `JPG`, or `PNG` formats.
In this step, configure the paper size of the PDF file and the dimensions of the exported images.
```Razor HtmlHelper
@(Html.Kendo().ChartWizard()
.Name("chartwizard")
.ExportOptions(export =>
{
export.Pdf(pdf => pdf.PaperSize("A4"));
export.Image(image => image.Width(1900).Height(1200));
})
.DataSource(dataSource => dataSource
.Read(read => read.Action("Read", "Home"))
)
.DataColumns(columns =>
{
columns.Add().Field(f => f.ProductName).Title("Product Name");
columns.Add().Field(f => f.Quantity);
})
)
```
```Razor TagHelper
@addTagHelper *, Kendo.Mvcl
```
## 5. Configure the Window Options
You can use the configuration options of the [Window](https://www.telerik.com/aspnet-core-ui/documentation/html-helpers/layout/window/overview) component to customize the appearance of the window that holds the Chart Wizard.
```Razor HtmlHelper
@(Html.Kendo().ChartWizard()
.Name("chartwizard")
.ExportOptions(export =>
{
export.Pdf(pdf => pdf.PaperSize("A4"));
export.Image(image => image.Width(1900).Height(1200));
})
.Window(window =>
{
window.Modal(false);
window.Actions(actions => actions
.Minimize()
.Maximize()
.Close()
);
window.Resizable(resizable => resizable.Enabled(true));
window.Height(550);
window.Width(700);
})
.DataSource(dataSource => dataSource
.Read(read => read.Action("Read", "Home"))
)
.DataColumns(columns =>
{
columns.Add().Field(f => f.ProductName).Title("Product Name");
columns.Add().Field(f => f.Quantity);
})
)
```
```Razor TagHelper
@addTagHelper *, Kendo.Mvcl
@{
string[] windowActions = new string[] { "Minimize", "Maximize", "Close" };
}
```
## 6. (Optional) Reference Existing Chart Wizard Instances
Referencing existing component instances allows you to build on top of their configuration. To reference an existing Chart Wizard instance, use the [`jQuery.data()`](http://api.jquery.com/jQuery.data/) method.
1. Use the `Name()` option of the component to establish a reference.
```JS script
```
2. Use the [Chart Wizard client-side API](https://docs.telerik.com/kendo-ui/api/ui/chartwizard#methods) to control the behavior of the component. In this example, you will see how to open the Chart Wizard (for example, when a button is clicked).
```Razor HtmlHelper
@(Html.Kendo().Button()
.Name("btn")
.Content("Open Chart Wizard")
.Events(ev => ev.Click("onBtnClick")))
```
```Razor TagHelper
@addTagHelper *, Kendo.Mvc
Open Chart Wizard
```
For more information on referencing specific helper instances, see the [Methods and Events](https://www.telerik.com/aspnet-core-ui/documentation/html-helpers/helper-basics/events-and-methods) article.
## Next Steps
* [Configuring the Chart Wizard Export Options](https://www.telerik.com/aspnet-core-ui/documentation/html-helpers/chartwizard/export)
* [Customizing the Window of the Chart Wizard](https://www.telerik.com/aspnet-core-ui/documentation/html-helpers/chartwizard/window-configuration)
* [Handling JavaScript Events of the User Interactions](https://www.telerik.com/aspnet-core-ui/documentation/html-helpers/chartwizard/events)
## See Also
* [Using the API of the Chart Wizard for ASP.NET Core (Demo)](https://demos.telerik.com/aspnet-core/chartwizard/api)
* [Client-Side API of the Chart Wizard](https://docs.telerik.com/kendo-ui/api/ui/chartwizard)
* [Server-Side API of the Chart Wizard](https://www.telerik.com/aspnet-core-ui/documentation/api/chartwizard)
* [Server-Side API of the Chart Wizard TagHelper](https://www.telerik.com/aspnet-core-ui/documentation/api/taghelpers/chartwizard)