# ASP.NET Core Chart Overview
[The Telerik UI Chart TagHelper and HtmlHelper for ASP.NET Core](https://www.telerik.com/aspnet-core-ui/charts) are server-side wrappers for the Kendo UI Chart widget. To add the component to your ASP.NET Core app, you can use either.
The Chart uses modern browser technologies to render high-quality data visualizations. All graphics are rendered on the client by using [Scalable Vector Graphics (SVG)](https://en.wikipedia.org/wiki/Scalable_Vector_Graphics) with a fallback to [Canvas](http://www.canvasgfx.com/). The Charts support a [set of series types](https://www.telerik.com/aspnet-core-ui/documentation/html-helpers/charts/chart-types/area-charts) such as Bar, Line, Area, Bullet, Pie, Scatter, Bubble, Polar, and others.
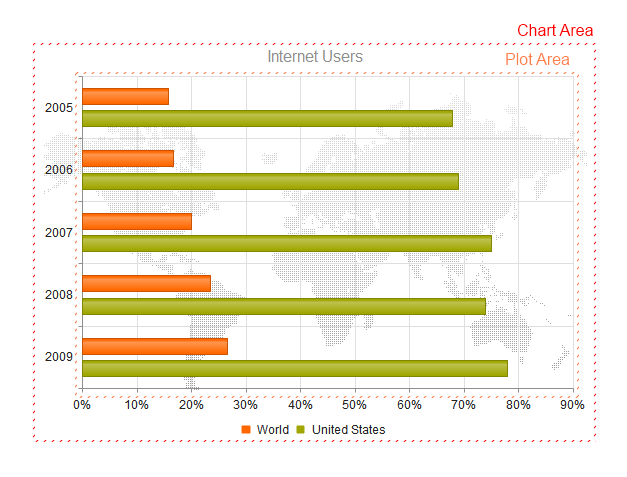
The following image displays the structure of the Chart.
To see the component in action, check the examples:
* [Demo page for ASP.NET Core Charts](https://demos.telerik.com/aspnet-core/charts)
## Initializing the Chart
The following example demonstrates how to define the Chart.
```Razor HtmlHelper
@(Html.Kendo().Chart(Model)
.Name("internetUsersChart") // The name of the Chart is mandatory. It specifies the "id" attribute of the widget.
.Title("Internet Users")
.Series(series => {
series.Bar(model => model.Value) // Create a Bar Chart series bound to the "Value" property.
.Name("United States");
})
.CategoryAxis(axis => axis
.Categories(model => model.Year)
)
)
```
```Razor TagHelper
@addTagHelper *, Kendo.Mvc
```
```C# Controller
public ActionResult Index()
{
return View(ChartDataRepository.InternetUsers());
}
```
The Chart contains the following [building block elements](https://www.telerik.com/aspnet-core-ui/documentation/html-helpers/charts/elements/data-series):
| Element | Description |
| ------------- | --------------------------------------------------------------------------------------------------------------------------------------------------------------------------------------------------------------------------------------------------------------------------------------------------------------------------------------------------------------------------------------------------------------------------------------------------------------------------------------------------------- |
| Title | The Chart provides extensive configuration options for its title. [See the client-side properties for the `Title` of the Chart component](https://docs.telerik.com/kendo-ui/api/dataviz/ui/chart/configuration/title). |
| Legend | The Chart provides extensive configuration options for its legend. [See the client-side properties for the `Legend` of the Chart](https://docs.telerik.com/kendo-ui/api/dataviz/ui/chart/configuration/legend). |
| Chart area | The chart area represents the entire visible area of the Chart. [See the client-side properties for the `Chart Area` of the Chart component](https://docs.telerik.com/kendo-ui/api/dataviz/ui/chart/configuration/chartarea). |
| Plot Area | The plot area displays the series in the Chart. [See the client-side properties for the `Plot Area ` of the Chart component](https://docs.telerik.com/kendo-ui/api/dataviz/ui/chart/configuration/plotarea). |
| Axis defaults | The Chart provides default options that are valid for all Chart axes. This element accepts the options supported by [`categoryAxis`](https://docs.telerik.com/kendo-ui/api/dataviz/ui/chart/configuration/categoryaxis), [`valueAxis`](https://docs.telerik.com/kendo-ui/api/dataviz/ui/chart/configuration/valueaxis), [`xAxis`](https://docs.telerik.com/kendo-ui/api/dataviz/ui/chart/configuration/xaxis), and [`yAxis`](https://docs.telerik.com/kendo-ui/api/dataviz/ui/chart#configuration-yAxis). |
| Series | The Chart provides various configuration options for its series. The series type is determined by the value of the type field. If a type value is missing, the type is assumed to be the one specified in `seriesDefaults`. |
## Basic Configuration
To configure the Chart, pass the configuration options as attributes:
```Razor HtmlHelper
@(Html.Kendo().Chart()
.Name("chart")
.Title("Gross domestic product growth /GDP annual %/")
.Legend(legend => legend
.Position(ChartLegendPosition.Top)
)
.ChartArea(chartArea => chartArea
.Background("transparent")
)
.Series(series =>
{
series.Column(new double[] { 3.907, 7.943, 7.848, 9.284, 9.263, 9.801, 3.890, 8.238, 9.552, 6.855 }).Name("India");
series.Column(new double[] { 4.743, 7.295, 7.175, 6.376, 8.153, 8.535, 5.247, -7.832, 4.3, 4.3 }).Name("Russian Federation");
series.Column(new double[] { 0.010, -0.375, 1.161, 0.684, 3.7, 3.269, 1.083, -5.127, 3.690, 2.995 }).Name("Germany");
series.Column(new double[] { 1.988, 2.733, 3.994, 3.464, 4.001, 3.939, 1.333, -2.245, 4.339, 2.727 }).Name("World");
})
.CategoryAxis(axis => axis
.Name("series-axis")
.Line(line => line.Visible(false))
)
.CategoryAxis(axis => axis
.Name("label-axis")
.Categories("2002", "2003", "2004", "2005", "2006", "2007", "2008", "2009", "2010", "2011")
)
.ValueAxis(axis => axis
.Numeric()
.Labels(labels => labels.Format("{0}%"))
// Move the label-axis all the way down the value axis.
.AxisCrossingValue(0, int.MinValue)
)
.Tooltip(tooltip => tooltip
.Visible(true)
.Format("{0}%")
.Template("#= series.name #: #= value #")
)
)
```
```Razor TagHelper
@addTagHelper *, Kendo.Mvc
```
### Axis Title
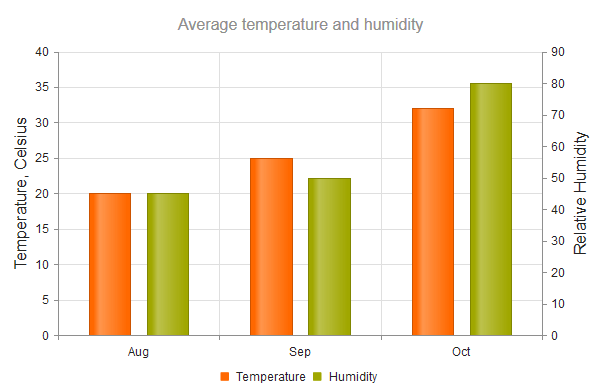
You can also add a title to clearly indicate the role of the axis.
```Razor HtmlHelper
@(Html.Kendo().Chart()
.Name("chart")
.Title("Average temperature and humidity")
.Legend(legend => legend
.Position(ChartLegendPosition.Bottom)
)
.Series(series => {
series.Column(new double[] { 20, 25, 32 }).Name("Temperature").Axis("temperature");
series.Column(new double[] { 45, 50, 80 }).Name("Humidity").Axis("humidity");
})
.CategoryAxis(axis => axis
.Categories("Aug", "Sep", "Oct")
.AxisCrossingValue(0, 3)
)
.ValueAxis(axis => axis
.Numeric()
.Name("temperature")
.Title(t=>t.Text("Temperature, Celsius"))
)
.ValueAxis(axis => axis
.Numeric()
.Name("humidity")
.Title(t=>t.Text("Relative Humidity"))
)
)
```
```Razor TagHelper
@addTagHelper *, Kendo.Mvc
@{
var categories = new string[] { "Aug", "Sep", "Oct" };
}
```
### Plot Bands
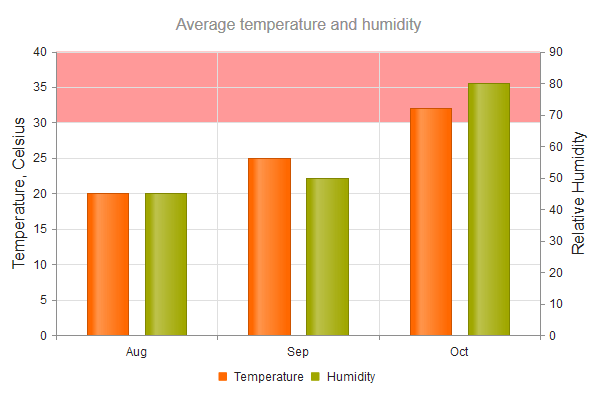
The Chart enables you to configure each axis to display bands with different colors for predefined value ranges. The category index (zero-based) is used as a value for the category axis.
```Razor HtmlHelper
.ValueAxis(axis => axis.Numeric()
.Labels(labels => labels.Format("{0:N0}"))
.MajorUnit(10000)
.Max(70000)
.Line(line => line.Visible(false))
.PlotBands(bands => {
bands.Add().From(10000).To(30000).Color("#c00").Opacity(0.3);
bands.Add().From(30000).To(30500).Color("#c00").Opacity(0.8);
})
)
```
```Razor TagHelper
```
### Global Settings
You may also need to apply global settings that affect all axes. In such cases, use [`AxisDefaults`](https://www.telerik.com/aspnet-core-ui/documentation/api/kendo.mvc.ui.fluent/chartbuilder#axisdefaultssystemaction).
```Razor HtmlHelper
.AxisDefaults(a=> a
.Labels(l=>l.Font("16px Verdana"))
)
```
```Razor TagHelper
```
## Functionality and Features
* [Data binding](https://www.telerik.com/aspnet-core-ui/documentation/html-helpers/charts/data-binding)—You can populate the Telerik UI Chart for ASP.NET Core with data by binding it to inline data, local data, or remote data.
* [Appearance](https://www.telerik.com/aspnet-core-ui/documentation/html-helpers/charts/appearance)—Unlike other Telerik UI for ASP.NET Core components which use only CSS for styling, you can control the appearance of the Chart elements primarily by using JavaScript style options.
* [No Data Template](https://www.telerik.com/aspnet-core-ui/documentation/html-helpers/charts/no-data-template)—The Chart for ASP.NET Core allows you to display a message when there is no data to show. Here’s how to set up a custom message for scenarios where the chart data is unavailable.
* [Series Patterns](https://www.telerik.com/aspnet-core-ui/documentation/html-helpers/charts/series-patterns)—The Telerik UI Chart component for ASP.NET Core offers customization options for presenting data visually, including support for using patterns in chart series.
## Chart Types
The Telerik UI for ASP.NET Core Chart supports an extensive set of series types.
| Chart type | Description |
| ----------------------------------------------------------------------------------------------------------------------------- | ---------------------------------------------------------------------------------------------------------------------------------------------------- |
| [Categorical Charts](https://www.telerik.com/aspnet-core-ui/documentation/html-helpers/charts/chart-types/categorical-charts) | Categorical Charts use a single category axis and a single value axis. |
| [Scatter Charts](https://www.telerik.com/aspnet-core-ui/documentation/html-helpers/charts/chart-types/scatter-charts) | Scatter Charts display data as points that are defined by the values of their items. |
| [Area Charts](https://www.telerik.com/aspnet-core-ui/documentation/html-helpers/charts/chart-types/area-charts) | Area Charts display quantitative data by using continuous lines that pass through points defined by the values of their items. |
| [Bar Charts](https://www.telerik.com/aspnet-core-ui/documentation/html-helpers/charts/chart-types/bar-charts) | Bar Charts display data using horizontal or vertical bars whose length varies according to their values. |
| [Box Plot Charts](https://www.telerik.com/aspnet-core-ui/documentation/html-helpers/charts/chart-types/boxplot-charts) | Box Plot Charts are useful for displaying variations in statistical samples of data and data details in a small space. |
| [Bubble Charts](https://www.telerik.com/aspnet-core-ui/documentation/html-helpers/charts/chart-types/bubble-charts) | Bubble Charts display data as points with coordinates and sizes determined by the values of their items. |
| [Bullet Charts](https://www.telerik.com/aspnet-core-ui/documentation/html-helpers/charts/chart-types/bullet-charts) | Bullet Charts represent a variation of the [Bar Chart](https://www.telerik.com/aspnet-core-ui/documentation/html-helpers/charts/bar-chart/overview). |
| [Funnel Charts](https://www.telerik.com/aspnet-core-ui/documentation/html-helpers/charts/chart-types/funnel-charts) | Funnel Charts are suitable for representing stages in a sales process and for showing the amount of the potential revenue from each stage. |
| [Line Charts](https://www.telerik.com/aspnet-core-ui/documentation/html-helpers/charts/chart-types/line-charts) | Line Charts are suitable for displaying quantitative data by using continuous lines passing through points defined by the values of their items. |
| [Pie Charts](https://www.telerik.com/aspnet-core-ui/documentation/html-helpers/charts/chart-types/pie-charts) | Pie Charts display data as single-series sectors from a two-dimensional circle which is useful for rendering data as a part of the whole. |
| [Polar Charts](https://www.telerik.com/aspnet-core-ui/documentation/html-helpers/charts/chart-types/polar-charts) | Polar Charts represent the relationships between data points in terms of radiuses and angles in a circular coordinate system. |
| [Donut Charts](https://www.telerik.com/aspnet-core-ui/documentation/html-helpers/charts/chart-types/donut-charts) | Donut Charts are a Pie chart variation with the ability to display data as single-series sectors from a two-dimensional circle. |
| [StockChart](https://www.telerik.com/aspnet-core-ui/documentation/html-helpers/charts/stockchart/overview) | StockCharts visualize the price movement of any financial instrument over a certain period. |
## Referencing Existing Instances
To reference an existing Chart instance, use the [`jQuery.data()`](http://api.jquery.com/jQuery.data/) configuration option. Once a reference is established, use the [Chart client-side API](https://docs.telerik.com/kendo-ui/api/dataviz/ui/chart#methods) to control its behavior.
```JavaScript
// Place the following after the Chart for ASP.NET Core declaration.
```
## Next Steps
* [Getting Started with the Bar Chart](https://www.telerik.com/aspnet-core-ui/documentation/html-helpers/charts/bar-chart/getting-started)
* [Basic Usage of the Chart for ASP.NET Core (Demo)](https://demos.telerik.com/aspnet-core/charts)
* [Chart in Razor Pages](https://www.telerik.com/aspnet-core-ui/documentation/html-helpers/charts/razor-page)
## See Also
* [All Chart Types](https://www.telerik.com/aspnet-core-ui/documentation/html-helpers/charts/chart-types/overview)
* [Bar Chart](https://www.telerik.com/aspnet-core-ui/documentation/html-helpers/charts/bar-chart/overview)
* [Sparkline](https://www.telerik.com/aspnet-core-ui/documentation/html-helpers/charts/sparkline/overview)
* [StockChart](https://www.telerik.com/aspnet-core-ui/documentation/html-helpers/charts/stockchart/overview)
* [Knowledge Base Section](https://www.telerik.com/aspnet-core-ui/documentation/knowledge-base)