UI for WPF
WPF TreeMap and PivotMap
- The Telerik TreeMap and PivotMap are data visualization components used to display hierarchical data as a set of nested rectangles. Each rectangle has an area proportional to a specified dimension on the data. Both Maps are useful when a lot of data has to be compared in a limited space. When the color and size dimensions are correlated with the tree structure in some way, patterns usually otherwise difficult to spot, are clearly visible.
- Part of the Telerik UI for WPF library along with 160+ professionally-designed UI controls.
- Includes support, documentation, demos, virtual classrooms, Visual Studio Extensions and more!
-
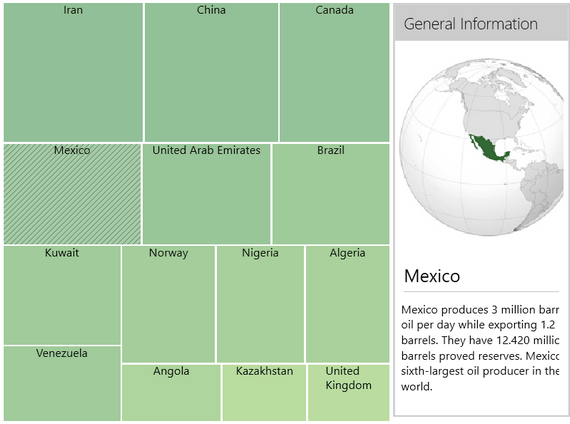
RadPivotMap for Grouping
Incorporating the same visualization technology as RadTreeMap, define grouping by specific values and also enable runtime modification of the visuals within the control.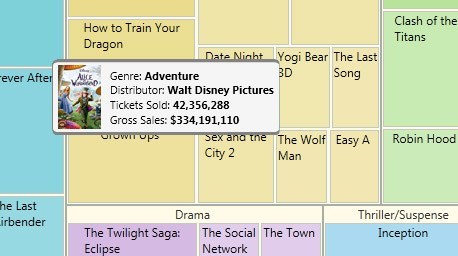
-
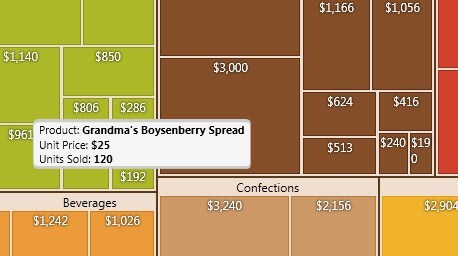
RadTreeMap for Hierarchical Data
Effortlessly turn hierarchical data into meaningful representations that can be colorized and visualized to fit your needs.