UI for ASP.NET AJAX
ASP.NET AJAX PivotGrid
- Advanced ASP.NET AJAX PivotGrid control for rich data visualization and multi-dimensional data analysis with OLAP & KPIs support, scrolling, sorting, filtering and paging.
- Part of the Telerik UI for ASP.NET AJAX library along with 120+ professionally designed UI components.
- Includes support, documentation, demos, virtual classrooms and more!
-
Data Binding
Use any declarative data source control (AccessDataSource, SqlDataSource, LinqDataSource, EntityDataSource, ObjectDataSource, XmlDataSource), or bind the Excel-like pivot table for ASP.NET to your custom objects on the fly. You can also bind RadPivotGrid programmatically by leveraging the NeedDataSource event fired only when the control needs to get fresh data instead of upon every postback. In addition to data grouping by a simple type, such as string or int, the advanced ASP.NET pivot table control allows you to group data by custom objects.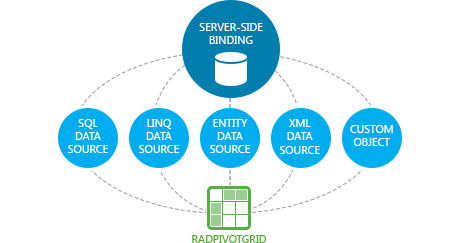
-
OLAP and KPIs Support
Bind Telerik ASP.NET Pivot Grid control to OLAP data sources through the XMLA and ADOMD.NET data providers to easily display, sort, page and filter data and KPIs from your Cube. The accompanying hierarchical Field List is fully optimized to load the entire structure of the bound OLAP data source on demand.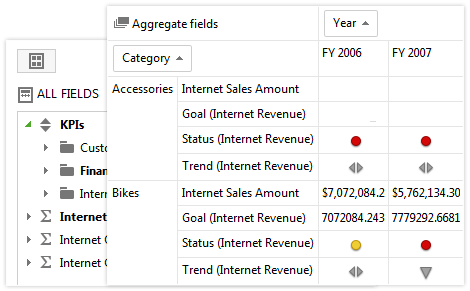
-
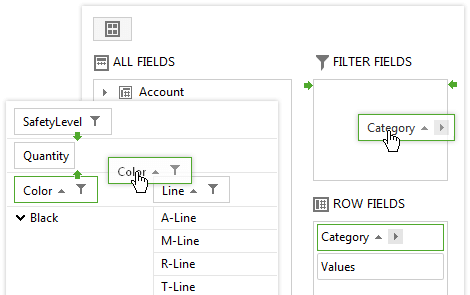
Easy End-User Configuration via Fields List and Field Zones
With RadPivotGrid for ASP.NET AJAX you enable users to see data from different perspectives by filtering, sorting, showing or hiding certain information or changing the row, column and filter fields. They can achieve this via:
- The context menus on the field zones
- Drag and drop between the different field zones
- The Excel-like Field List which also enables them to add new fields to the report
-
Filtering and Displaying Top Values
Use a single property to enable powerful filtering mechanism in RadPivotGrid and enable your end users to filter pivoted and OLAP data like in Excel. They can choose to filter by a label, value or to use the report filter and visually hide some fields from the report, while still being able to filter by it. The value filter “Top” allows your users to look at just the best or worst values and concentrate only on the most important for them information.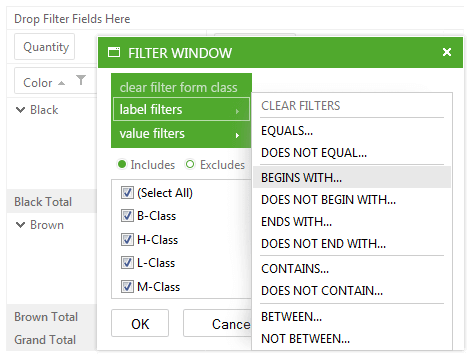
-
Sorting
Leverage the built-in sorting of RadPivotGrid to allow end users to sort the Row and Column data in an ascending or descending manner. -
Scrolling
In case RadPivotGrid displays more information than you can fit in the page design, it takes the setting of one property for you to enable scrolling with frozen header rows. Don’t worry this will harm the performance of your application, because we have designed the rendering of the Pivot Table to be light and fast. -
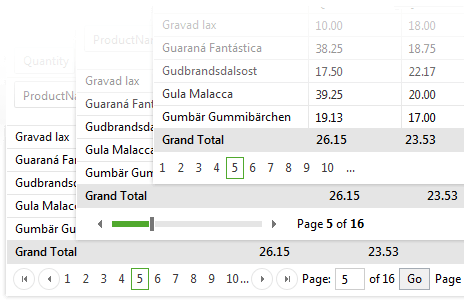
Paging
Enable RadPivotGrid pagination for it to load only a portion of the data at once, for better performance. Define the page size and pager position which will best suit your end user experience. Choose between the built-in numeric, previous and next, slider or more advanced paging modes.
-
Export to Microsoft Excel
Users can export the content of the Pivot Grid to an XLS file supported in all versions of Microsoft Excel starting from 2003. Allow them to export the whole content of the pivot or just the content of the current page. Use the infrastructure to provide supplementary information to your users in additional sheets of the exported file. -
Range Grouping for Customizable Level of Detail
If the report displays certain information by day, but the user is interested in seeing the data for the whole month or quarter, the range grouping will allow them to achieve this with just a couple of clicks. The Telerik Pivot Table Component for ASP.NET AJAX supports three types of grouping by ranges: DateTime, numeric and custom. This means you can choose time spans: Year, Quarter, Month, Day; numeric ranges 0-100, 100-200, 200-300 etc.; or flexible implementation in a custom way. -
Aggregate Functions and Positions
Quickly select or change the aggregate functions you use for your data. Choose between sum, average, count, max, min, or something more complicated like standard deviation, variance, or product. All of this is done in the easiest possible manner – just one line of code or a couple of clicks with the Field List. In addition, you may also change the position of the row and column totals - top, bottom, right, left, or none. -
Totals Calculations
Enable calculations to allow users to further analyze the aggregated data by comparing cells to each other. For each cell they will be able to compute the percentage of the GrandTotal, compute the difference from its previous or next one, calculate its weighted average, etc., thus discovering its relative importance.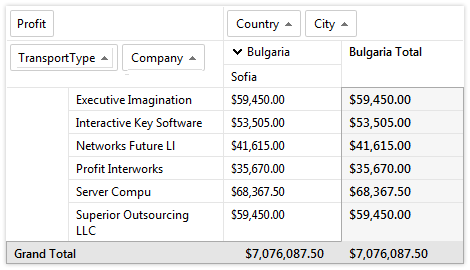
-
Layouts
Depending on the requirements for your application, you can choose between three of the most widely used pivot report layouts: Tabular, Outline and Compact.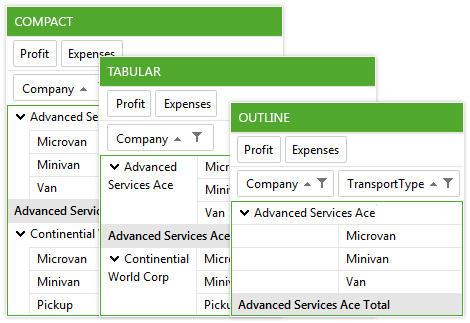
-
Hierarchical Data Display
Allow your users to choose the details with which they want to examine data. Group multiple row or column fields to allow users to expand and collapse the parent groups and achieve the desired detail level.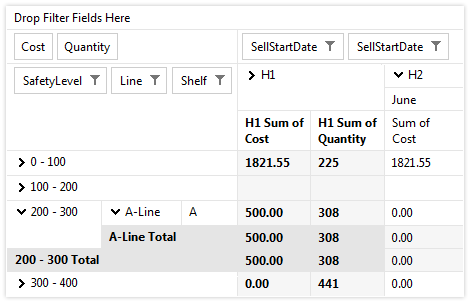
-
Conditional Formatting
Want to have green fields indicate positive numbers and red negative numbers? RadPivotGrid for ASP.NET AJAX can easily be designed to display styles depending on the values of the cells.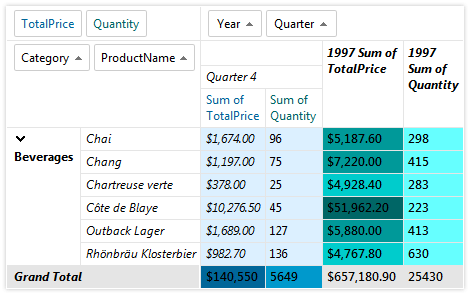
-
Tooltips
Use the RadPivotGrid tooltips to display additional information for the cells, such as their value and associated aggregate, row, and column. You can also set your own tooltips or simply disable them. The structure of the data in the tooltips follows the pattern used in Microsoft Excel. -
Templates
If you need to define your own templates instead of using the built-in cell elements of the Telerik ASP.NET PivotGrid, you can easily define exactly what to be displayed in a certain cell. The control has12 different cell templates allowing you to customize each of its parts and even place other controls into the different types of cells.
-
Rich Server-Side and Client-Side API for Maximum Flexibility
Take advantage of the public methods, properties, and events found within our ASP.NET OLAP control in order to implement advanced and specific scenarios, such as integrating it with a Chart or Map control. Almost all user actions raise an event which provides all the arguments you need, both on the client and the server.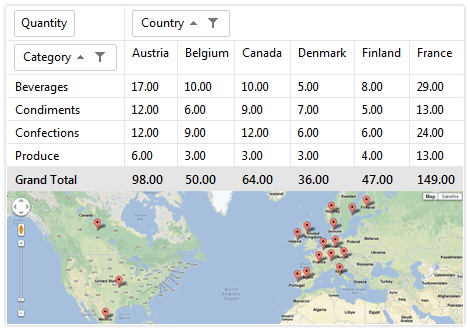
-
Performance
To make sure RadPivotGrid performs well, we:
- Optimize its server code following best coding practices
- Minimize the HTML, CSS and JS for smaller traffic and faster loading
- Keep as few values in the ViewState as possible
- Execute only the mission-critical JavaScript to initialize the client objects
- Provide you with free CDN support to deliver content faster to your users
-
Accessibility and Internationalization
The Telerik PivotGrid control was built for compliance with major accessibility standards, such as W3C Web Content Accessibility Guidelines 1.0/2.0 and Section 508 of the Rehabilitation Act. Leverage the built-in WAI-ARIA support by changing a single property to have the pivot grid render appropriate WAI-ARIA roles. For international applications, use global or local resources to completely localize the control. -
Visual Studio Integration and Design-time Support
Install Telerik UI for ASP.NET AJAX, the suite containing RadPivotGrid, to get the control available in your Visual Studio Toolbox. Drag and drop it onto the design surface and use the SmartTag, the Properties Window or the rich Design-Time wizards to codelessly configure the PivotGrid and make it fully functional. -
Easy to AJAX-Enable
RadPivotGrid for ASP.NET AJAX was built from the ground up to work in AJAX-enabled web sites and you can easily ajaxify it using ASP:UpdatePanel, RadAjax or other ajax controls extending the Microsoft AJAX Framework. -
Built-In Skins
Use a single property to apply any of the 20 ready-to-use built-in themes, including an innovative mobile skin, to create a consistence look for your apps and save design and front-end development time. You can easily customize our existing skins or create your own with our Visual Style Builder.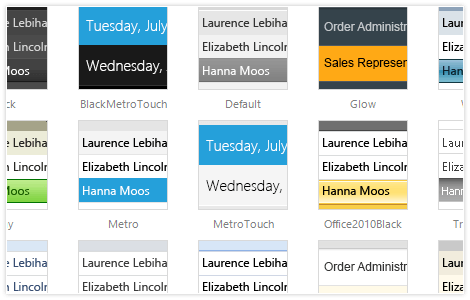
-
Mobile Support
Why should you build a mobile version of your application when the same app can work equally well on mobile and desktop devices? The Telerik ASP.NET PivotGrid makes this possible by handling touch events in the same manner as those triggered by a keyboard or a mouse. In addition, the control comes with a mobile skin especially designed for a better user experience on touch devices.
-
Cross-Browser Support
When using our ASP.NET Pivot Table in your apps, you can rest assured that it behaves as expected and has a consistent look and feel in all browsers your users may be utilizing.
Read the full list of supported browsers