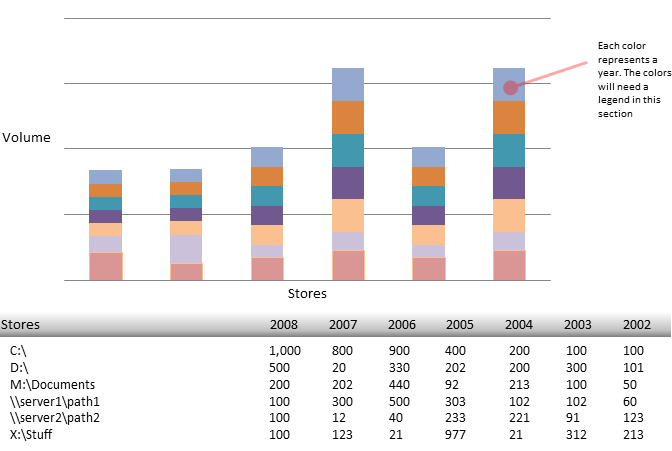
I've been struggling to create a stacked bar chart with that will display the following data:

I realize that since the columns (years) are dynamic that i must create the chart in codebehind. However, I've been lost with trying to figure out how to loop through the data (in the form of a datatable, that looks exactly like the grid in the screenshot above) and what item mappings and/or groupsettings to specifiy. Any help with figuring this out would be most appreciated! Thanks
I realize that since the columns (years) are dynamic that i must create the chart in codebehind. However, I've been lost with trying to figure out how to loop through the data (in the form of a datatable, that looks exactly like the grid in the screenshot above) and what item mappings and/or groupsettings to specifiy. Any help with figuring this out would be most appreciated! Thanks

