Hi,
i have a problem using RadHtmlChart here my code:
in .aspx
<telerik:RadHtmlChart runat="server" ID="PieChart4" Width="425px" Height="280px" Transitions="true" Style="float: left;" Skin="black" DataSourceID="SqlDataSource1">
<Appearance >
<FillStyle BackgroundColor="Transparent" />
</Appearance>
<ChartTitle Text="Resons Count">
<Appearance Align="Center" Position="Top" />
</ChartTitle>
<PlotArea>
<Series>
<telerik:PieSeries StartAngle="90" DataField="count" Name="sReason">
<LabelsAppearance Position="Circle" DataFormatString="{0} times" />
</telerik:PieSeries>
</Series>
</PlotArea>
</telerik:RadHtmlChart>
<asp:SqlDataSource ID="SqlDataSource1" runat="server" ConnectionString="...."
SelectCommand="SELECT sReason,count from (SELECT dbo.AccountingType.iAccountingTypeID, dbo.AccountingType.sReason, COUNT(dbo.AccountingType.iAccountingTypeID) AS count
FROM dbo.Accounting INNER JOIN
dbo.AccountingType ON dbo.Accounting.iAccountingTypeID = dbo.AccountingType.iAccountingTypeID INNER JOIN
dbo.ConsistCycle ON dbo.Accounting.iConsistCycleID = dbo.ConsistCycle.iConsistCycleID
WHERE (NOT (dbo.AccountingType.sReason IS NULL)) AND (CONVERT(datetime, CONVERT(varchar, dbo.ConsistCycle.dt7MileArrivalActual, 101), 101) >= CONVERT(DATETIME, @dt7MileArrivalActualFrom, 102)) AND (CONVERT(datetime, CONVERT(varchar, dbo.ConsistCycle.dt7MileArrivalActual, 101), 101) <= CONVERT(DATETIME, @dt7MileArrivalActualTo, 102)) GROUP BY dbo.AccountingType.iAccountingTypeID, dbo.AccountingType.sReason) as tab1">
<SelectParameters>
<asp:Parameter Name="dt7MileArrivalActualFrom" DefaultValue="" />
<asp:Parameter Name="dt7MileArrivalActualTo" DefaultValue="" />
</SelectParameters>
</asp:SqlDataSource>
and this is the result
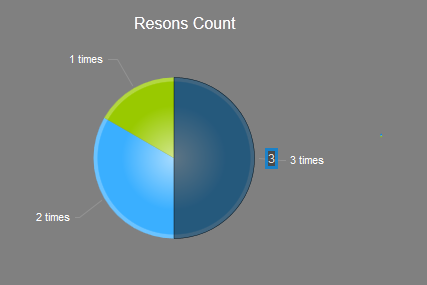
What i can do to show the Name property of each series in the legend?
Pls help me!
Thanks
i have a problem using RadHtmlChart here my code:
in .aspx
<telerik:RadHtmlChart runat="server" ID="PieChart4" Width="425px" Height="280px" Transitions="true" Style="float: left;" Skin="black" DataSourceID="SqlDataSource1">
<Appearance >
<FillStyle BackgroundColor="Transparent" />
</Appearance>
<ChartTitle Text="Resons Count">
<Appearance Align="Center" Position="Top" />
</ChartTitle>
<PlotArea>
<Series>
<telerik:PieSeries StartAngle="90" DataField="count" Name="sReason">
<LabelsAppearance Position="Circle" DataFormatString="{0} times" />
</telerik:PieSeries>
</Series>
</PlotArea>
</telerik:RadHtmlChart>
<asp:SqlDataSource ID="SqlDataSource1" runat="server" ConnectionString="...."
SelectCommand="SELECT sReason,count from (SELECT dbo.AccountingType.iAccountingTypeID, dbo.AccountingType.sReason, COUNT(dbo.AccountingType.iAccountingTypeID) AS count
FROM dbo.Accounting INNER JOIN
dbo.AccountingType ON dbo.Accounting.iAccountingTypeID = dbo.AccountingType.iAccountingTypeID INNER JOIN
dbo.ConsistCycle ON dbo.Accounting.iConsistCycleID = dbo.ConsistCycle.iConsistCycleID
WHERE (NOT (dbo.AccountingType.sReason IS NULL)) AND (CONVERT(datetime, CONVERT(varchar, dbo.ConsistCycle.dt7MileArrivalActual, 101), 101) >= CONVERT(DATETIME, @dt7MileArrivalActualFrom, 102)) AND (CONVERT(datetime, CONVERT(varchar, dbo.ConsistCycle.dt7MileArrivalActual, 101), 101) <= CONVERT(DATETIME, @dt7MileArrivalActualTo, 102)) GROUP BY dbo.AccountingType.iAccountingTypeID, dbo.AccountingType.sReason) as tab1">
<SelectParameters>
<asp:Parameter Name="dt7MileArrivalActualFrom" DefaultValue="" />
<asp:Parameter Name="dt7MileArrivalActualTo" DefaultValue="" />
</SelectParameters>
</asp:SqlDataSource>
and this is the result
What i can do to show the Name property of each series in the legend?
Pls help me!
Thanks
12 Answers, 1 is accepted
0


Hello Claudio,
In the upcoming Q3 2012 release there will be more databinding properties to the PieSeries so that you can take the Name for each item from the database. For the time being you can loop through the data in the code-behind and create items programmatically so that you can set their Name property accordingly.
Regards,
Marin Bratanov
the Telerik team
If you want to get updates on new releases, tips and tricks and sneak peeks at our product labs directly from the developers working on the RadControls for ASP.NET AJAX, subscribe to their blog feed now.
0

Claudio
Top achievements
 Rank 1
answered on 12 Oct 2012, 06:07 AM
Thanks,
i wait for the new release and in the meantime i will do it programmatically.
i wait for the new release and in the meantime i will do it programmatically.
0
Qurat
Top achievements
Rank 1
answered on 09 Mar 2013, 11:31 AM
hi
i am trying to use client template for my radhtmlchart but i am unable to do it because i am using a dataset from the DB.
i tried using this
//PieChart1.PlotArea.Series[0].TooltipsAppearance.ClientTemplate = ds.Tables[0].ToString();
it is also not working.
please help me i have to submit the project and i have very less time
here is a piece of code :
DataSet ds = DbHelper.ReadTable(sql1);
if (ds != null && ds.Tables[0] != null && ds.Tables[0].Rows != null && ds.Tables[0].Rows.Count > 0)
{
//string[] arr = new string[15];
for (int i = 0; i < ds.Tables[0].Rows.Count; i++)
{
SeriesItem si = new SeriesItem();
si.YValue = (decimal)ds.Tables[0].Rows[i]["VoteShare"];
si.Name = (string)ds.Tables[0].Rows[i]["PartyName"];
si.BackgroundColor = System.Drawing.ColorTranslator.FromHtml((string)ds.Tables[0].Rows[i]["PartyColor"]);
PieChart1.PlotArea.Series[0].Items.Add(si);
//PieChart1.PlotArea.Series[0].TooltipsAppearance.ClientTemplate = (string)ds.Tables[0].Rows[i]["PartyName"];
//arr[i]=si.Name.ToString();
}
//PieChart1.PlotArea.Series[0].TooltipsAppearance.ClientTemplate = ds.Tables[0].ToString();
attaching my project files
regards
@nnu shah
punjab lok sujag
0
Hello Qurat,
It seems that you are creating the Series of the HtmlChart programmatically. ClientTemplates, however, can only be used when the HtmlChart is databound to a datasource. More information on the topic is available here.
Therefore you can review you current logic, so that instead of creating the whole HtmlChart programmatically, you create a sample datasource programmatically which in turn can be databound to the HtmlChart itself.
I have created a short example on how to do that in the attached archive. The example is with ColumnSeries but the same logic can be used for PieSeries as well. I hope that helps.
Greetings,
Danail Vasilev
the Telerik team
If you want to get updates on new releases, tips and tricks and sneak peeks at our product labs directly from the developers working on the RadControls for ASP.NET AJAX, subscribe to their blog feed now.
0
Qurat
Top achievements
Rank 1
answered on 14 Mar 2013, 06:11 AM
hi Danail,
the problem is that i am taking the data from database, DbHelper.ReadTable(sql1); is extracting data from the database(mysql)
in this senario how can i use client template.
i also tried doing this way,still no change
for (int i = 0; i < ds.Tables[0].Rows.Count; i++)
{
PieSeries pi = new PieSeries();
pi.Name = (string)ds.Tables[0].Rows[i]["PartyName"];
pi.DataFieldY = (string)ds.Tables[0].Rows[i]["VoteShare"];
pi.ColorField = "#66CCFF";
pi.TooltipsAppearance.ClientTemplate = (string)ds.Tables[0].Rows[i]["PartyName"];
PieChart1.PlotArea.Series.Add(pi);
}
regards
Qurat ul ain shah
0
Hello Qurat,
You can try to databind the RadHtmlChart to the dataset datasource and then reference the PieSeries to load data from the respective datasource columns through DataFieldY, ColorField, NameField and ExplodeField properties. This approach lets you to use the ClientTemplates as well. For example:
ASPX:
C#:
You can also have look at this online demo related on how to databind the RadHtmlChart to a dataset and this online demo related on how to use ClientTemplates.
Note also the following:
Greetings,
Danail Vasilev
the Telerik team
You can try to databind the RadHtmlChart to the dataset datasource and then reference the PieSeries to load data from the respective datasource columns through DataFieldY, ColorField, NameField and ExplodeField properties. This approach lets you to use the ClientTemplates as well. For example:
ASPX:
<telerik:RadHtmlChart runat="server" ID="RadHtmlChart1" Width="500px" Height="500px"> <PlotArea> <Series> <telerik:PieSeries ExplodeField="IsExploded" DataFieldY="VoteShare" ColorField="PartyColor" NameField="PartyName"> <LabelsAppearance Position="Circle" ClientTemplate="#=dataItem.VoteShare#" /> <TooltipsAppearance ClientTemplate="#=dataItem.PartyName#" /> </telerik:PieSeries> </Series> </PlotArea></telerik:RadHtmlChart>protected void Page_Load(object sender, EventArgs e){ if (!IsPostBack) { RadHtmlChart1.DataSource = GetData(); RadHtmlChart1.DataBind(); }}protected DataSet GetData(){ DataSet DS = new DataSet(); DataTable tbl = new DataTable(); tbl.Columns.Add(new DataColumn("VoteShare")); tbl.Columns.Add(new DataColumn("PartyName")); tbl.Columns.Add(new DataColumn("PartyColor")); tbl.Columns.Add(new DataColumn("IsExploded")); tbl.Rows.Add(new object[] { 50, "apple", "Red", false }); tbl.Rows.Add(new object[] { 10, "orange", "Orange", true }); tbl.Rows.Add(new object[] { 15, "lime", "Yellow", true }); tbl.Rows.Add(new object[] { 25, "blueberry", "Blue", true }); DS.Tables.Add(tbl); return DS;}Note also the following:
- You can have only one PieSeries within the RadHtmlChart which can have multiple SeriesItems.
- ClientTemplates can only be used if the RadHtmlChart is databound to a datasource. If the Series, however, are created programmatically then ClientTemplates cannot be used.
- Sever-side properties - DataFieldY, ColorField, NameField and ExplodeField should only reference columns from a datasource which is databound to the RadHtmlChart.
Greetings,
Danail Vasilev
the Telerik team
If you want to get updates on new releases, tips and tricks and sneak peeks at our product labs directly from the developers working on the RadControls for ASP.NET AJAX, subscribe to their blog feed now.
0
Qurat
Top achievements
Rank 1
answered on 19 Mar 2013, 11:53 AM
hi,
thanks alot for the quick response there is just one problem i am using mysql database and tables to get data.
#=dataitem doesnt seem to work in this case.there is lots of data only database use is suitable.
here is the link the page i am working on.
http://www.lokpunjab.org/elections/PieChart.aspx
regards
@nnu
punjab lok sujag
0
Hello Qurat,
It seems that the RadHtmlChart you are using is not databound to a datasource. As I have already mentioned in one of my previous posts, in order to use the ClientTemplates the RadHtmlChart should be databound to a datasource. You can find more information on using client templates in this help article as well as in this online demo. My post from 15-Mar-2013 also shows how to do that.
If, however, your RadHtmlChart is not databound to a datasource, but rather its Series are created programmatically then you cannot use the ClientTemplate. You can, however, recreate your logic in order to simulate a datasource which is to be databound. My VS sample from 13-Mar-2013, shows an example on how to do that.
I hope that helps.
Greetings,
Danail Vasilev
the Telerik team
If you want to get updates on new releases, tips and tricks and sneak peeks at our product labs directly from the developers working on the RadControls for ASP.NET AJAX, subscribe to their blog feed now.
0
Ricardo Pinto
Top achievements
Rank 1
answered on 15 May 2013, 02:12 PM
Hello Danail.
You mentioned some server-side properties - DataFieldY, ColorField, NameField and ExplodeField.
I can only find DataFieldY and ColorField!
I have the following chart declaration:
Then I use a combo to change the chart datasource on selected index changed event:
The pie slices and values change accordingly, but the labels disappear.
I tried setting the NameField attribute also on the combo event, but can not find it:
Is there anything I can do? I'm using Q1 2013 SP2.
Can you show me some better approaches to have related datasources (student by state, student by genre, student by age, etc.) shown on same chart upon user selection?
Thanks in advance!
Best regards,
Ricardo.
You mentioned some server-side properties - DataFieldY, ColorField, NameField and ExplodeField.
I can only find DataFieldY and ColorField!
I have the following chart declaration:
<telerik:RadHtmlChart runat="server" ID="StudentStatsChart" Height="300px" Width="300px" DataSourceID="SqlDataSource1"> <PlotArea> <Series> <telerik:PieSeries DataFieldY="Number" NameField="State" ExplodeField="IsExploded"> <LabelsAppearance DataFormatString="{0}"> </LabelsAppearance> <TooltipsAppearance DataFormatString="{0}"></TooltipsAppearance> </telerik:PieSeries> </Series> <YAxis> </YAxis> </PlotArea> <ChartTitle Text="Student"> </ChartTitle> </telerik:RadHtmlChart>Then I use a combo to change the chart datasource on selected index changed event:
Protected Sub cbChart_SelectedIndexChanged(sender As Object, e As RadComboBoxSelectedIndexChangedEventArgs) If cbChart.SelectedValue = "0" Then StudentStatsChart.DataSourceID = "SqlDataSource1" StudentStatsChart.DataBind() ElseIf cbChart.SelectedValue = "1" Then StudentStatsChart.DataSourceID = "SqlDataSource2" StudentStatsChart.DataBind() End If End SubThe pie slices and values change accordingly, but the labels disappear.
I tried setting the NameField attribute also on the combo event, but can not find it:
StudentStatsChart.PlotArea.Series(0).ColorFieldStudentStatsChart.PlotArea.Series(0).DataFieldYIs there anything I can do? I'm using Q1 2013 SP2.
Can you show me some better approaches to have related datasources (student by state, student by genre, student by age, etc.) shown on same chart upon user selection?
Thanks in advance!
Best regards,
Ricardo.
0
Hi Ricardo,
The NameField is a property that is specific only for the Pie and Donut series. Therefore in order to access it in the code behind you should initially cast the series(0) to the appropriate Pie/Donut series type. For example:
Regarding your second question about changing the datasource of the RadHtmlChart it is a good approach to use different SqlDataSources that use the same database but differ by their SelectCommand. We have used also this approach in HtmlChart - Drill-down Chart online demo.
Greetings,
Danail Vasilev
the Telerik team
The NameField is a property that is specific only for the Pie and Donut series. Therefore in order to access it in the code behind you should initially cast the series(0) to the appropriate Pie/Donut series type. For example:
TryCast(StudentStatsChart.PlotArea.Series(0), PieSeries).NameField = "State"Regarding your second question about changing the datasource of the RadHtmlChart it is a good approach to use different SqlDataSources that use the same database but differ by their SelectCommand. We have used also this approach in HtmlChart - Drill-down Chart online demo.
Greetings,
Danail Vasilev
the Telerik team
If you want to get updates on new releases, tips and tricks and sneak peeks at our product labs directly from the developers working on the RadControls for ASP.NET AJAX, subscribe to their blog feed now.
0
Pratik
Top achievements
Rank 1
answered on 02 Jun 2016, 06:47 AM
I'm facing still this issue.. I bind my Pie series with sqldatasource.. but Legend is still not visible
<telerik:RadHtmlChart ID="h12" runat="server" DataSourceID="SqlDataSource2" Height="350px" InvokeLoadData="AfterPageLoad" Width="450px" Skin="Vista"> <PlotArea> <Series> <telerik:PieSeries StartAngle="90" VisibleInLegend="true" DataFieldY="VCOUNT"> <LabelsAppearance Position="OutsideEnd" DataFormatString="{0}"> </LabelsAppearance> <TooltipsAppearance> <ClientTemplate> #=dataItem.VCOUNT# Inspection done for #=dataItem.INSPECTION_NAME# </ClientTemplate> </TooltipsAppearance> </telerik:PieSeries> </Series> </PlotArea> <ChartTitle Text="Inspections done in last 12 months"> <Appearance Align="Left" Position="Top"> <TextStyle FontFamily="Tahoma" FontSize="11pt" /> </Appearance> </ChartTitle> <Legend> <Appearance Position="Top" Orientation="Horizontal" Visible="true" > </Appearance> </Legend> <Zoom Enabled="False"> </Zoom> </telerik:RadHtmlChart> <asp:SqlDataSource ID="SqlDataSource2" runat="server" ConnectionString="<%$ ConnectionStrings:iWaveConnectionString %>" SelectCommand="SP_JoT_OPS_INSPECTION_PERFORM_Type" SelectCommandType="StoredProcedure"> <SelectParameters> <asp:SessionParameter Name="COMPANYID" SessionField="USERCOMPANYID" Type="String" /> <asp:Parameter DefaultValue="3" Name="TYPE" Type="Int32" /> </SelectParameters> </asp:SqlDataSource>0
Hi Pratik,
You should define the NameField property of the chart - http://demos.telerik.com/aspnet-ajax/htmlchart/examples/clientsidedatabinding/defaultcs.aspx
More information on the matter is available here - http://docs.telerik.com/devtools/aspnet-ajax/controls/htmlchart/troubleshooting/common-issues#legend-is-not-visible
Regards,
Danail Vasilev
Telerik
Do you need help with upgrading your ASP.NET AJAX, WPF or WinForms projects? Check the Telerik API Analyzer and share your thoughts.