This question is locked. New answers and comments are not allowed.
Hello,
Is there any guidance in performance profiling of SharePoint 2010 solutions using JustTrace?
In our case we are interested in profiling application pages (ASPX pages in _layouts folder).
Tried attaching to the process, but cannot do that because CLR 4.0 or higher is required.
Thanks!
Is there any guidance in performance profiling of SharePoint 2010 solutions using JustTrace?
In our case we are interested in profiling application pages (ASPX pages in _layouts folder).
Tried attaching to the process, but cannot do that because CLR 4.0 or higher is required.
Thanks!
12 Answers, 1 is accepted
0


Hello boredgeek,
Thank you for contacting our support.
This is achievable with the ASP.NET (IIS) profilee. Just enter the sharepoint url into the URL text box and hit the Run button.
Please, let me know if I can help you with anything else.
Regards,
Kaloyan
Telerik
Thank you for contacting our support.
This is achievable with the ASP.NET (IIS) profilee. Just enter the sharepoint url into the URL text box and hit the Run button.
Please, let me know if I can help you with anything else.
Regards,
Kaloyan
Telerik
0

boredgeek
Top achievements
 Rank 1
answered on 24 Jan 2014, 07:06 PM
Hi Kaloyan,
Thanks for the reply. I tried that and it successfully attached. Unfortunately the page never loads, just keeps loading for hours, then the profiler disconnects.
I am running JustTrace on a Hyper-V VM. Is this a problem? Should I use physical machine for performance profiling?
Thanks!
Thanks for the reply. I tried that and it successfully attached. Unfortunately the page never loads, just keeps loading for hours, then the profiler disconnects.
I am running JustTrace on a Hyper-V VM. Is this a problem? Should I use physical machine for performance profiling?
Thanks!
0
Accepted
Hi boredgeek,
JustTrace works as good on virtual machines as on physical ones. So, this should not be the issue.
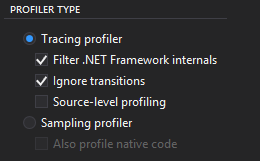
To help you further I will need some more information. Firstly, is there any specific error message upon the profiler disconnect? Can you try and start the performance profiling session with disabled Filter .NET Framework internals, Ignore transitions and Source-level profiling (check this article for more details). Finally, I will need you to Send a Feedback (check how, here) with attached logs right after the issue has occurred.
Thank you for the help in advance.
Regards,
Kaloyan
Telerik
JustTrace works as good on virtual machines as on physical ones. So, this should not be the issue.
To help you further I will need some more information. Firstly, is there any specific error message upon the profiler disconnect? Can you try and start the performance profiling session with disabled Filter .NET Framework internals, Ignore transitions and Source-level profiling (check this article for more details). Finally, I will need you to Send a Feedback (check how, here) with attached logs right after the issue has occurred.
Thank you for the help in advance.
Regards,
Kaloyan
Telerik
0
boredgeek
Top achievements
Rank 1
answered on 03 Feb 2014, 05:23 PM
Yes, that worked. I have some other issues, but I will open another thread about them.
Thank you very much!
Thank you very much!
0
boredgeek
Top achievements
Rank 1
answered on 17 Feb 2014, 10:12 PM
I would like to reopen this thread. I am still getting issues profiling SharePoint site. The home page never comes up. Here's the event log message:
Event code: 3001
Event message: The request has been aborted.
Event time: 2/17/2014 9:32:26 PM
Event time (UTC): 2/17/2014 9:32:26 PM
Event ID: 62acd64289834d49802fa911309f55c6
Event sequence: 14
Event occurrence: 3
Event detail code: 0
Application information:
Application domain: /LM/W3SVC/39141818/ROOT-1-130371457604533857
Trust level: Full
Application Virtual Path: /
Application Path: C:\inetpub\wwwroot\wss\VirtualDirectories\80\
Machine name: HWDEVCOMMERCE3
Process information:
Process ID: 6128
Process name: w3wp.exe
Account name: CPSDEV\sv-hwdev-csruntime
Exception information:
Exception type: HttpException
Exception message: Request timed out.
Request information:
Request URL: http://hwdevcommerce3/en-US/Pages/default.aspx
Request path: /en-US/Pages/default.aspx
User host address: 192.168.1.20
User:
Is authenticated: False
Authentication Type:
Thread account name: CPSDEV\sv-hwdev-csruntime
Thread information:
Thread ID: 17
Thread account name: CPSDEV\sv-hwdev-csruntime
Is impersonating: False
Stack trace:
Custom event details:
0
Hello boredgeek,
Have you tried to increase the request execution timeout for ASP.NET? You can see how to do this here.
Please, let me know of the results.
Regards,
Kaloyan
Telerik
Have you tried to increase the request execution timeout for ASP.NET? You can see how to do this here.
Please, let me know of the results.
Regards,
Kaloyan
Telerik
0
boredgeek
Top achievements
Rank 1
answered on 21 Feb 2014, 05:59 PM
Thanks for your reply!
I was successful in running sampling profiler without "Restart IIS" option. I also had "Start with profiler suspended"
All other attempts result in timeout.
Also I should mention that ours is a multi-tier application, so we have another IIS site that is running WCF services. Not sure if that makes any difference.
0

Hello boredgeek,
If you have managed to successfully start a sampling profiler session then it seems that the only thing that prevents you from profiling with the tracing profiler, is the timeout that is seen in the event log. The tracing profiler hijacks every method entry and exit, which makes it a lot slower than the sampling one and depending on the application and the machine it is run on it might slow down the application significantly.
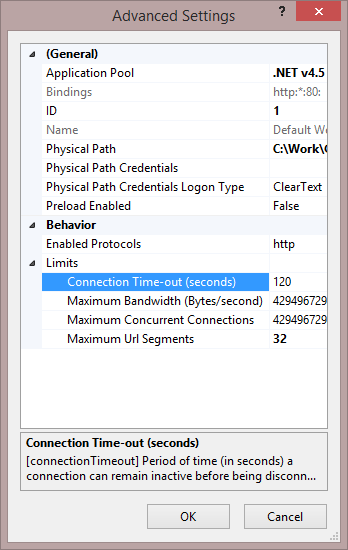
Can you, please, increase the connection timeout and retry profiling again? To do it right click on the site in IIS Manager and go to Manage Web Site -> Advanced Settings. Under Connection Limits you should see Connection Time-out:
I hope this helps!
Kind regards,
Martin
Telerik
If you have managed to successfully start a sampling profiler session then it seems that the only thing that prevents you from profiling with the tracing profiler, is the timeout that is seen in the event log. The tracing profiler hijacks every method entry and exit, which makes it a lot slower than the sampling one and depending on the application and the machine it is run on it might slow down the application significantly.
Can you, please, increase the connection timeout and retry profiling again? To do it right click on the site in IIS Manager and go to Manage Web Site -> Advanced Settings. Under Connection Limits you should see Connection Time-out:
I hope this helps!
Kind regards,
Martin
Telerik
0
boredgeek
Top achievements
Rank 1
answered on 28 Feb 2014, 10:08 PM
Hi,
Changed the timeout to 1 hour.
Still getting timeout.
The first message is:
.NET Runtime version 2.0.50727.5477 - Failed to CoCreate profiler.
Then:
Error: RuntimeFilter: Failed to load all runtime filter configurations or the runtime filter component. Exception has been thrown by the target of an invocation.
Then:
Event code: 3001
Event message: The request has been aborted.
Event time: 2/28/2014 9:50:56 PM
Event time (UTC): 2/28/2014 9:50:56 PM
Event ID: 7146241b6acb4e20bf9746d7e8206867
Event sequence: 4
Event occurrence: 1
Event detail code: 0
Application information:
Application domain: /LM/W3SVC/39141818/ROOT-1-130380976987356111
Trust level: Full
Application Virtual Path: /
Application Path: C:\inetpub\wwwroot\wss\VirtualDirectories\80\
Machine name: HWDEVCOMMERCE3
Process information:
Process ID: 3096
Process name: w3wp.exe
Account name: CPSDEV\sv-hwdev-csruntime
Exception information:
Exception type: HttpException
Exception message: Request timed out.
Request information:
Request URL: http://hwdevcommerce3/en-US/Pages/default.aspx
Request path: /en-US/Pages/default.aspx
User host address: fe80::2cec:3415:ad8f:b9d0
User:
Is authenticated: False
Authentication Type:
Thread account name: CPSDEV\sv-hwdev-csruntime
Thread information:
Thread ID: 9
Thread account name: CPSDEV\sv-hwdev-csruntime
Is impersonating: False
Stack trace:
Custom event details:
Thanks!
0
Hi Michael,
After changing the timeout did you have to wait for an hour before the error occurred? If no, then it seems that the setting doesn't affect the timeout. Can you please try once more with checked Filter .NET Framework internals and Ignore transitions options:
If profiling fails again, please send us feedback from withing JustTrace. Just make sure that the Attach log files option is checked. This will help us better analyze what might have gone wrong!
You mentioned that you are profiling on a virtual machine. Besides being slower, profiling on a VM can generate somewhat misleading performance data, so I would recommend you to profile on a real machine, if possible.
Looking forward to your response!
Best regards,
Martin
Telerik
DevCraft Q1'14 is here! Join the free online conference to see how this release solves your top-5 .NET challenges. Reserve your seat now!
0
boredgeek
Top achievements
Rank 1
answered on 06 Mar 2014, 07:19 PM
Still getting timeouts. Send feedback as instructed.
Thanks for your help!
Thanks for your help!
0
Hi Michael,
I sent you an answer in the support ticket. I suggest that we continue our communication regarding this issue there.
Regards,
Martin
Telerik
I sent you an answer in the support ticket. I suggest that we continue our communication regarding this issue there.
Regards,
Martin
Telerik
DevCraft Q1'14 is here! Watch the online conference to see how this release solves your top-5 .NET challenges. Watch on demand now.