Hi, I've got a situation where I need a chart to create a new line series based on user selection (i.e., user selects 3 Employees from a list of 10 to compare, and then the chart will show 3 Line series, each corresponding to the respective employee's annual revenue to date).
Most of the examples rely on code-behind to create a new SeriesMapping and then add it to the chart's list of mappings. I'm curious if there would be any declarative way to account for a varying number of Series on a chart, similar to a DataTemplate used for other controls. To bind the number of Series to a collection where each Series binds to a sub-collection.
Here's a grid I have working for just one series:
<telerik:RadChart Name="LapTimes" DataContext="{Binding SelectedEmployees}" ItemsSource="{Binding Employee.SalesList}"> <telerik:RadChart.SeriesMappings> <telerik:SeriesMapping LegendLabel="Employee"> <telerik:SeriesMapping.SeriesDefinition> <telerik:LineSeriesDefinition ShowItemLabels="False"> </telerik:LineSeriesDefinition> </telerik:SeriesMapping.SeriesDefinition> <telerik:SeriesMapping.ItemMappings> <telerik:ItemMapping FieldName="SalesNum" DataPointMember="XValue"/> <telerik:ItemMapping FieldName="SalesValue" DataPointMember="YValue"/> </telerik:SeriesMapping.ItemMappings> </telerik:SeriesMapping> </telerik:RadChart.SeriesMappings> </telerik:RadChart>SelectedEmployees is an ObservableCollection<Employee> and each Employee type has an ObservableCollection<Sale>.
That actually shows the first Employee in the collection just fine. But, how would I template my RadChart in a way that for each Employee in SelectedEmployees there's a Line Series using that Employee's Sales collection - without using code-behind?
18 Answers, 1 is accepted

You can follow our Nested Collections help article to achieve your scenario. Your code should look like this:
public partial class MainPage : UserControl { public MainPage() { InitializeComponent(); ObservableCollection<ObservableCollection<Sale>> employees = new ObservableCollection<ObservableCollection<Sale>>() { new ObservableCollection<Sale>(){ new Sale { YValue = 20 }, new Sale { YValue = 30 }, new Sale { YValue = 35 }, new Sale { YValue = 41 }}, new ObservableCollection<Sale>(){ new Sale { YValue = 12 }, new Sale { YValue = 34 }, new Sale { YValue = 67 }, new Sale { YValue = 78 }}, new ObservableCollection<Sale>(){ new Sale { YValue = 18 }, new Sale { YValue = 24 }, new Sale { YValue = 12 }, new Sale { YValue = 50 }} }; this.radChart.ItemsSource = employees; } } public class Sale { public double YValue { get; set; The databinding is made in markup by using SeriesMappings:
<telerik:RadChart x:Name="radChart"> <telerik:RadChart.DefaultView> <telerik:ChartDefaultView> <telerik:ChartDefaultView.ChartTitle> <telerik:ChartTitle Content="Trade Data" /> </telerik:ChartDefaultView.ChartTitle> </telerik:ChartDefaultView> </telerik:RadChart.DefaultView> <telerik:RadChart.SeriesMappings> <telerik:SeriesMapping LegendLabel="CSCO" CollectionIndex="0"> <telerik:SeriesMapping.SeriesDefinition> <telerik:LineSeriesDefinition ShowItemLabels="True" /> </telerik:SeriesMapping.SeriesDefinition> <telerik:SeriesMapping.ItemMappings> <telerik:ItemMapping DataPointMember="YValue" FieldName="YValue" /> </telerik:SeriesMapping.ItemMappings> </telerik:SeriesMapping> <telerik:SeriesMapping LegendLabel="MSFT" CollectionIndex="1"> <telerik:SeriesMapping.SeriesDefinition> <telerik:LineSeriesDefinition ShowItemLabels="True" /> </telerik:SeriesMapping.SeriesDefinition> <telerik:SeriesMapping.ItemMappings> <telerik:ItemMapping DataPointMember="YValue" FieldName="YValue" /> </telerik:SeriesMapping.ItemMappings> </telerik:SeriesMapping> </telerik:RadChart.SeriesMappings> </telerik:RadChart>NOTE that there are two CollectionIndex properties and the outer ObservableCollection has 3 elements. That should help you to come up with the idea that you can show only 3 Line Series from a collection of 10.
Kind regards,
Evgenia
the Telerik team

Here's an example from a different charting kit:
<multiChart:MultiChart SeriesSource="{Binding SelectedEmployees}"> <multiChart:MultiChart.SeriesTemplate> <DataTemplate> <toolkit:LineSeries DataPointStyle="{StaticResource CommonLineSeriesDataPoint}" Title="{Binding Path=Employee.FullName}" ItemsSource="{Binding Path=Employee.Sales}"IndependentValueBinding="{Binding OrderNum}" DependentValueBinding="{Binding SaleValue}" ClipToBounds="False" AnimationSequence="FirstToLast" > </toolkit:LineSeries> </DataTemplate> </multiChart:MultiChart.SeriesTemplate> </multiChart:MultiChart>What that allows for is a varying number of series depending on which Employees are in the "SelectedEmployees" ObservableCollection, which itself is propagated through routed commands tied to a list of check boxes.
I've seen examples of event driven code that create SeriesMappings, but that seems to violate good MVVM practices and is something we're trying to avoid to maintain clean, testable code. One of the main reasons we're currently evaluating your WPF toolkit is for charting purposes, and this kind of functionality is very important to us, as it is used in many applications of ours.
If anything like this already exists within RadChart, that would be excellent and a real time-saver from having to write a series of templating classes to extend the control ourselves.
I understand your scenario. Getting back to your requirement "SelectedEmployees is an ObservableCollection<Employee> and each Employee type has an ObservableCollection<Sale>" - this is demonstrated in a sample project attached. Feel free to modify the source code so that it applies your scenario (list of check boxes).
Let me explain a little bit more on how RadChart creates series from the data in the ItemsSource. To support complex scenarios RadChart introduces the SeriesMapping object. This non-visual element describes how the underlying data from the ItemsSource has to be mapped to the series. As you may want your series to be mapped differently, you have to add a SeriesMapping object for every series that you want to display on the screen.
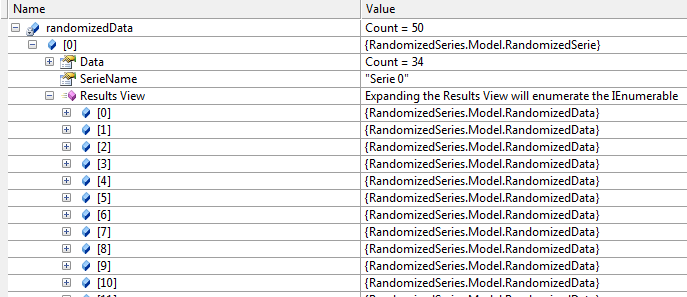
Currently RadChart's support for nested collections requires your seriesmapping to have collection index (described in our help topic) and the data for this mapping to be available in the underlying collection on the specified index like in the image below:
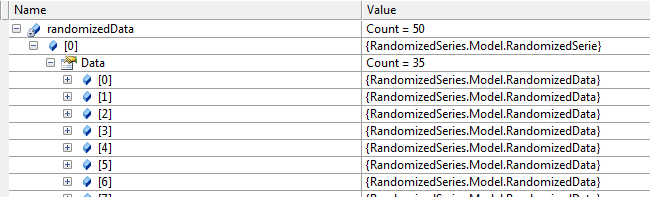
If you remove the IEnumerable implementation of your business object the data for the series will be accessible through the Data property like in the image below:
All the best,
Evgenia
the Telerik team
The reason this sample does not fit our requirements is that each SeriesMapping is being declared individually in the xaml. Until the user selects what to view, we do not know how many SeriesMappings we will need at any given time.
This must either be accomplished through eventing in code-behind (handling INotifyCollectionChanged in a custom chart control) or by creating a DataTemplate wrapper for SeriesMappings. The DataTemplate approach is much more elegant and extensible for use in other MVVM scenarios.
I'm sorry for the miscommunication.
The example attached shows how to create Series run-time using the MVVM pattern. The SeriesMappings are added in the ViewModel on CollectionChanged where the collection is ObservableCollection.
We are using SeriesMappings instead of DataTemplate as SeriesMappings are more granullar.
Kind regards,
Evgenia
the Telerik team
Any chance of having the MultiChart approach cited above in a future version? Binding everything declaratively is much more intuitive and MVVM friendly. Also, it makes my viewmodel completely independent of the charting choice.
Best Regards,
André Carlucci
We are sorry that our solution didn't meet your requirements.
However we implemented a new feature -> SeriesMapping ItemsSource which was added in our latest binaries. We believe It will be helpful for those who want to use declarative binding and will be much more MVVM friendly.
Regards,
Evgenia
the Telerik team
It's not about the ItemsSource in SeriesMapping, I would like to define a DataTemplate and just bind my collection.
The thing is that I don't want to create specific visual things in my viewmodel, so it remains very easy to unit test.
Anyway, I solved my problem extending the RadChart control to use DataTemplates for SeriesMapping, take a look here:
http://www.telerik.com/community/forums/silverlight/chart/extending-radchart-for-better-mvvm-binding.aspx
It's perfect now :)
@Nathan, tell me if you need the source code, maybe this solution can help you
Cheers,
André Carlucci
However, I just downloaded the trial again and am using the charting dll version 2010.3.1314.40 and I do not see an ItemsSource on SeriesMapping... what am I missing?
The Series Mappings ItemsSource feature is added in Q1 2011 binaries. Give it a try and let us know if you need further assistance.
Greetings,
Evgenia
the Telerik team
I'm using version 2011.2.920.40 of your binaries and I've tried binding to SeriesMappings dep property of RadChart, however, I found this not to work when the RadChart is inside a DataTemplate. For some reason the control is never databinding. You have any examples of binding to SeriesMappings and use the SeriesMappings ItemsSource to popuplate the chart inside a DataTemplate.
Thanks.
We have already answered this in the Support thread you've opened. The issue is logged in our Public Issue Tracking System, so you can track its status here.
Regards,
Evgenia
the Telerik team
Hi,
I'm in a similar scenario where I need to bind a chart to an object (it's a property of the ViewModel) similar to the randomizedData present in your example with the two screenshots, but with the difference that my object contains more then one property that represents a different graph so, following with your example, I have not only the Data property but also a Data2. In this scenario I'm not able to use an IEnumerable implementation, so I was trying to map my serie to the Data property: when you say that the data are "accessible through the Data property" how can the serie access the Data from xaml? I was expecting that the following code could work but it doesn't and the only way I've find is to set the SeriesMapping ItemSource serie directly to the property with ItemsSource={Binding randomizedData[0].Data}.This doesn't seems to represent the most elegant way, so do you think I could use some different approach?
Thank you,
Rocco
<telerikChart:RadChart x:Name="radChart" ItemsSource="{Binding randomizedData}"> <telerikChart:RadChart.DefaultView[...]> <telerikChart:RadChart.SeriesMappings> <telerikCharting:SeriesMapping CollectionIndex="0" ItemsSource="{Binding Data}" > <telerikCharting:SeriesMapping.SeriesDefinition> </telerikCharting:SeriesMapping.SeriesDefinition> <telerikCharting:ItemMapping DataPointMember="XValue" FieldName="X" /> <telerikCharting:ItemMapping DataPointMember="YValue" FieldName="Y" /> </telerikCharting:SeriesMapping> </telerikChart:RadChart.SeriesMappings></telerikChart:RadChart> I see what you are after, thanks for the detailed explanation.
Since you want each of your Series to have a different datasource, I believe it will be more suitable for you if you use our Multiple datasources feature as it is more MVVM friendly and use declarative binding. With it there is no need to have a common datasource for all your series and index it with CollectionIndex-es. You can simply map each series to its own collection of data. More information on this can be found in our documentation as well as online demo.
We implemented this functionality for our new Chart control too - RadChartView where each series requires its own ItemsSource. This is well described in our documentation. Even though it still lacks some of the features RadChart supports, RadChartView successfully addresses some of the limitations and deficiencies that we have identified in the RadChart implementation over the years. So you may consider using it in your scenarios instead. This help topic highlights the main features and functionality of the two charting controls, if you are interested in migrating to the new one.
Regards,
Evgenia
the Telerik team
Explore the entire Telerik portfolio by downloading Telerik DevCraft Ultimate.
I'm assuming that by meaning real data you mean data that changes periodically with time. I highly recommend that you take a look at our Live Data online QSF demo of RadChartView control with source code provided that demonstrates such scenario. As for the RadChartView control -- you might get to know it and its specifics and features from our documentation.
I hope this information helps.
Regards,
Evgenia
Telerik by Progress
Thanks for you Reply,
I got something in your suggested document ,but I want XAxis should display in top label not in bottom.
kindly look the attached screen shot to display the XAxis.
Please provide any solution for the same.

You can change the horizontal axis location using its VerticalLocation. For example:
<telerik:CategoricalAxis VerticalLocation="Top" />To change the direction of the numeric axis (LinearAxis for example) set its IsInverse property.
<telerik:LinearAxis IsInverse="True" />Regards,
Martin
Telerik by Progress