This is a migrated thread and some comments may be shown as answers.

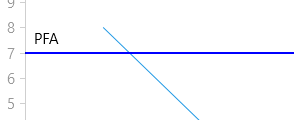
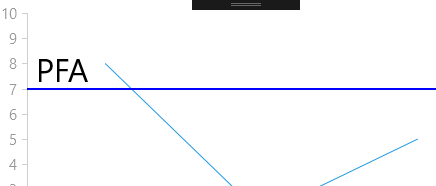
Chart Annotation label

1 Answer 105 Views
Chart
This is a migrated thread and some comments may be shown as answers.
VmlYr
Top achievements
Rank 1
VmlYr asked on 09 Jun 2017, 06:38 AM

Hi, I would like to add a Label over a line annotation. Is it possible? Basically it would be something like the screenshot attached.

I would also like to hide the vertical axis completely... can I do that?


Thanks

1 Answer, 1 is accepted

Sort by
0
Accepted
Lance | Manager Technical Support
Telerik team
answered on 12 Jun 2017, 08:27 PM
Hello Janet,

To answer your question about the axes first, see the example app in this thread. You can use a custom renderer and augment the native control's appearance.

Alternatively, you can style the line and ticks directly in Xamarin.Forms and have it blend into the background.


Annotation Label


Regarding the annotation label, currently there is no Label (or Text) property for Annotations (see here for the available properties). I have a

What you could do is render your own label on top of the Chart as the background will be transparent and not hide parts of the chart. However, you will need to figure out a way to know at which height to render the label. You could get a measurement of the Chart's height and determine an offset from the bottom (or top) that would bet close to your annotation.

For example, if you knew your data has a maximum value of 10, a minimum value of 0, and that you place your annotation at 7. You can calculate an offset that is 70% of the height of the chart (plus or minus where you want to position the label in respect to the annotation).

Demo

I've built you a simple demo to convey the idea (find ti attached). You would need to tweak this to meet your needs, but I think it gets the point across on how you can position a label with a little math:

Code - 

// The Annotation definition
var lineAnnotation = new CartesianGridLineAnnotation()
{
    Axis = chart.VerticalAxis,
    Value = 7,
    Stroke = Color.Blue,
    StrokeThickness = 2
};
 
chart.Annotations.Add(lineAnnotation);
 
// 1 - Get the value to offset the label by doing a little math on the annotation's value against the vertical axis's range
// this would be 10 because my min is 0 and max is 10, but make sure your math is robust enough to catch divide by zero and other related exceptions
 
var range = verticalAxis.Maximum - verticalAxis.Minimum;
var annotationPosition = (int)lineAnnotation.Value;
var percentOffset = annotationPosition / range;
 
// 2 - now, with the percentage to offset, calculate where to place the Label
 // (you can optimize the math for this, I am breaking down each step for visibility)
             
var offsetFromBottom = chart.HeightRequest * percentOffset;
var offsetFromTop = chart.HeightRequest - offsetFromBottom;
 
// 3 - Calculate the actual offset for the Label using it's FontSize and minor adjustment so that it's not rendered directly on top of the Annotation
var labelYOffset = offsetFromTop - AnnotationLabel.FontSize - 10;
 
// 4 - Finally, apply the values to the Label
AnnotationLabel.Margin = new Thickness(40, labelYOffset, 0, 0);
AnnotationLabel.Text = "PFA";
AnnotationLabel.IsVisible = true;


Screenshots at runtime (UWP):

Normal FontSize:


Large FontSize:


Regards,
Lance | Tech Support Engineer, Sr.
Progress Telerik
Do you want to have your say when we set our development plans? Do you want to know when a feature you care about is added or when a bug fixed? Explore the Telerik Feedback Portal and vote to affect the priority of the items
Tags
Chart
Asked by
VmlYr
Top achievements
Rank 1
Answers by
Lance | Manager Technical Support
Telerik team
Share this question
or