This is a migrated thread and some comments may be shown as answers.

2 PieCharts & 1 Legend with additional data (oh my!)

3 Answers 98 Views
Chart
This is a migrated thread and some comments may be shown as answers.
Shaun
Top achievements
Rank 1
Shaun asked on 23 Nov 2011, 09:17 PM
I'm a bit confused on what my options would be for accomplishing the following:


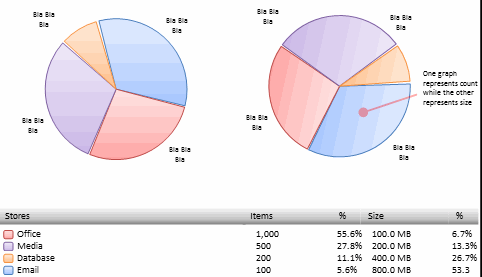
Basically, I need 2 piecharts with 1 legend, and the additional data fields associated with the legend items you see in the pic.  The 2 charts and legend must all have the same colors for the data/series items.

I've read previous posts about specifying colors for the chart legend and series mappings by creating palettes and doing codebehind to assign colors to both series items and legend items manually.  However, I'm not sure if either of these fit with what I'm tasked to do.
 I'm not sure if I can add additional data in the legend (i've seen that there is a legend controltemplate but not a datatemplate) via templating or adding a gridview control to it. If i can't inject additional data into the legend, is there a way i can bind to the pie item colors?

Any advice would be appreciated.  Thanks.

3 Answers, 1 is accepted

Sort by
0
Nikolay
Telerik team
answered on 28 Nov 2011, 08:22 AM
Hi Nk,

Indeed, the best approach in order to achieve a legend such as the one from the sample image would be to create a grid, in which you can place the desired data, similarly to our demo -> Chart -> Empty Values example.

As for the two Pie series, since you cannot have more than one Pie in a single ChartArea you may either decide to create a single chart with two ChartArea and a Pie in each one or two separate charts, placed next to each other. You may find a similar example in the demo -> Chart -> Smart Labels example.

Greetings,
Nikolay
the Telerik team
Explore the entire Telerik portfolio by downloading the Ultimate Collection trial package. Get it now >>
0
Shaun
Top achievements
Rank 1
answered on 01 Dec 2011, 11:35 PM
Thank you for the reply.  Regarding the legend with additional data, i looked at the sample but there are a few things that will not work for me.  I see that you have the series mappings manually specified:
                <charting:SeriesMapping LegendLabel="Lee Young" ChartAreaName="chartarea"><br>                    <charting:ItemMapping FieldName="Value1" DataPointMember="YValue" /><br>                    <charting:ItemMapping FieldName="Date" DataPointMember="XCategory" /><br>                </charting:SeriesMapping><br>                <charting:SeriesMapping LegendLabel="Linda Baker" ChartAreaName="chartarea"><br>                    <charting:ItemMapping FieldName="Value2" DataPointMember="YValue" /><br>                    <charting:ItemMapping FieldName="Date" DataPointMember="XCategory" /><br>                </charting:SeriesMapping><br>                <charting:SeriesMapping LegendLabel="Martin Thompson" ChartAreaName="chartarea"><br>                    <charting:ItemMapping FieldName="Value3" DataPointMember="YValue" /><br>                    <charting:ItemMapping FieldName="Date" DataPointMember="XCategory" /><br>                </charting:SeriesMapping>

I can't do it this way since I must bind "blindly" to a datatable and will not know how many or what the legend labels will be ahead of time.

Also I noticed that the colors for the rectangles are manually specified in the legend:
                       <telerik:GridViewDataColumn DataMemberBinding="{Binding Value1}" IsResizable="False" Width="40"><br>                            <telerik:GridViewColumn.Header><br>                                <StackPanel Margin="0,5"><br>                                    <b><Rectangle Fill="#FF8EBC00" Width="16" Height="16"/></b>

Not sure how i would know this and didn't see you specifying a color palette anywhere.  So how can this be bound to the colors that are used in the piechart (so match)?
0
Nikolay
Telerik team
answered on 06 Dec 2011, 10:05 AM
Hi Nk,

In case you have chosen the approach with inserting a GridView within or next to the Chart you may simply bind the property containing the desired legend labels to the Text property of the TextBlock ( in the GridViewColumn). There would be no need to create a mapping in the chart for the legend labels, as in this case the chart legend would be collapsed.

As for matching the colors, you may create a custom palette for the Chart, similarly to the approach demonstrated in our demo -> Chart -> Custom Palette example.

You may also find this help topic useful.

Greetings,
Nikolay
the Telerik team
Explore the entire Telerik portfolio by downloading the Ultimate Collection trial package. Get it now >>
Tags
Chart
Asked by
Shaun
Top achievements
Rank 1
Answers by
Nikolay
Telerik team
Shaun
Top achievements
Rank 1
Share this question
or